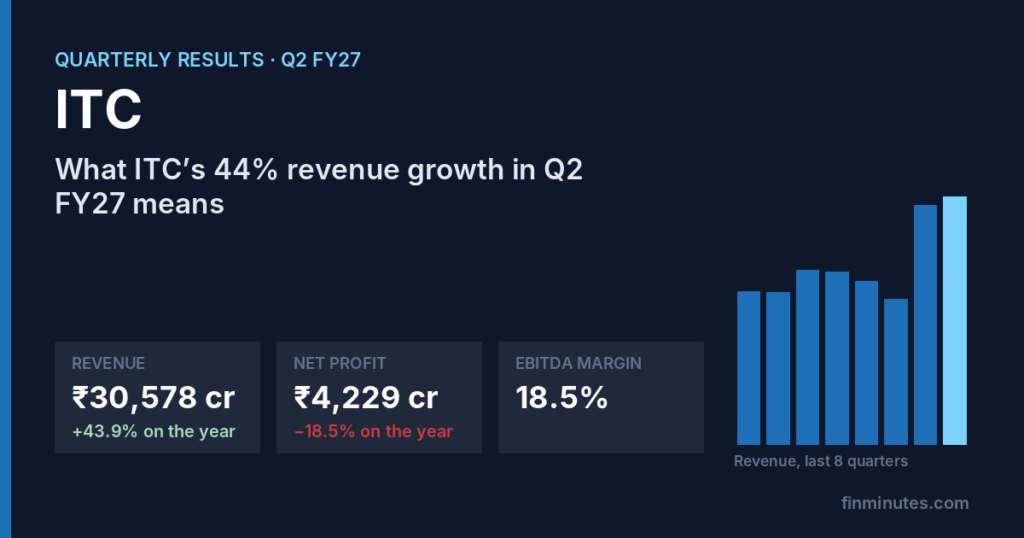
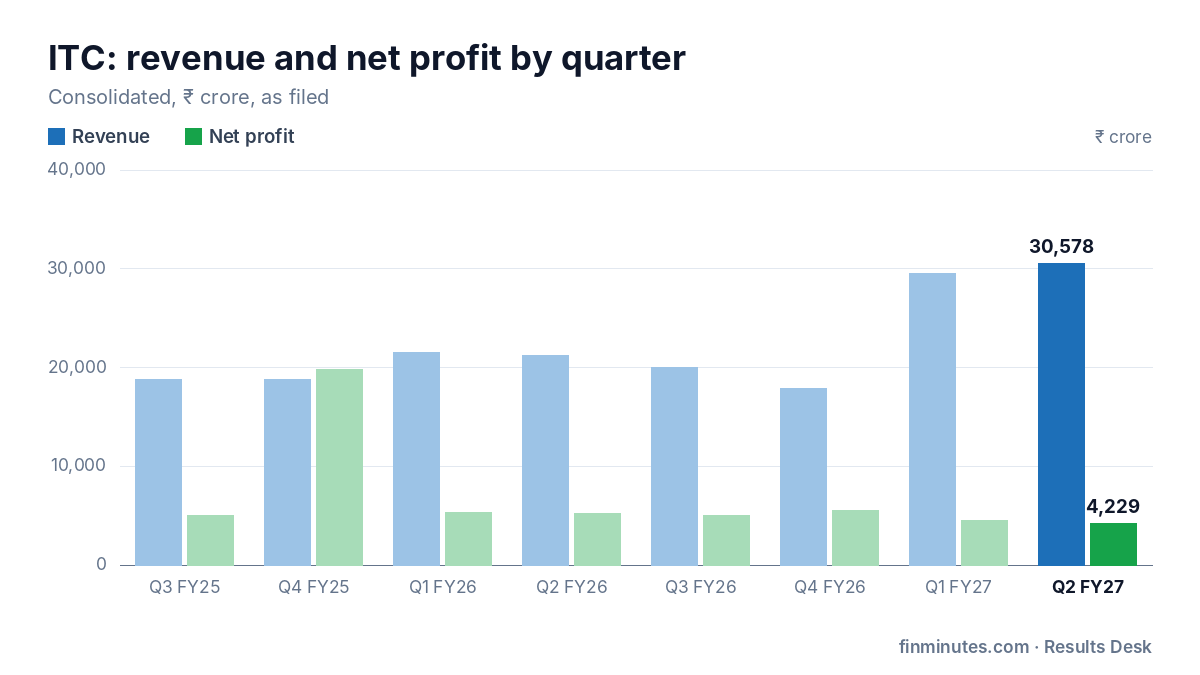
ITC Ltd. reported revenue of ₹30,578 cr for July to September 2026, +43.9% on the year and +3.6% on the quarter. That is faster than this quarter has grown in recent years (+9.4% on average), so the year-on-year number is not just the season. It is the highest quarterly revenue in the last 12 quarters on record. Over the last four quarters revenue comes to ₹97,974 cr, +22.0% on the four before.
The full ITC Q2 FY27 results page carries every quarter on the same rules, the checks that ran and the ones that need the filing read: ITC Q2 FY27 results, read forensically.
ITC Q2 FY27: the numbers
| Sep '26 | Previous quarter | A year ago | On the year | |
|---|---|---|---|---|
| Revenue | ₹30,578 cr | ₹29,523 cr | ₹21,256 cr | +43.9% |
| EBITDA | ₹5,645 cr | ₹5,181 cr | ₹6,695 cr | −15.7% |
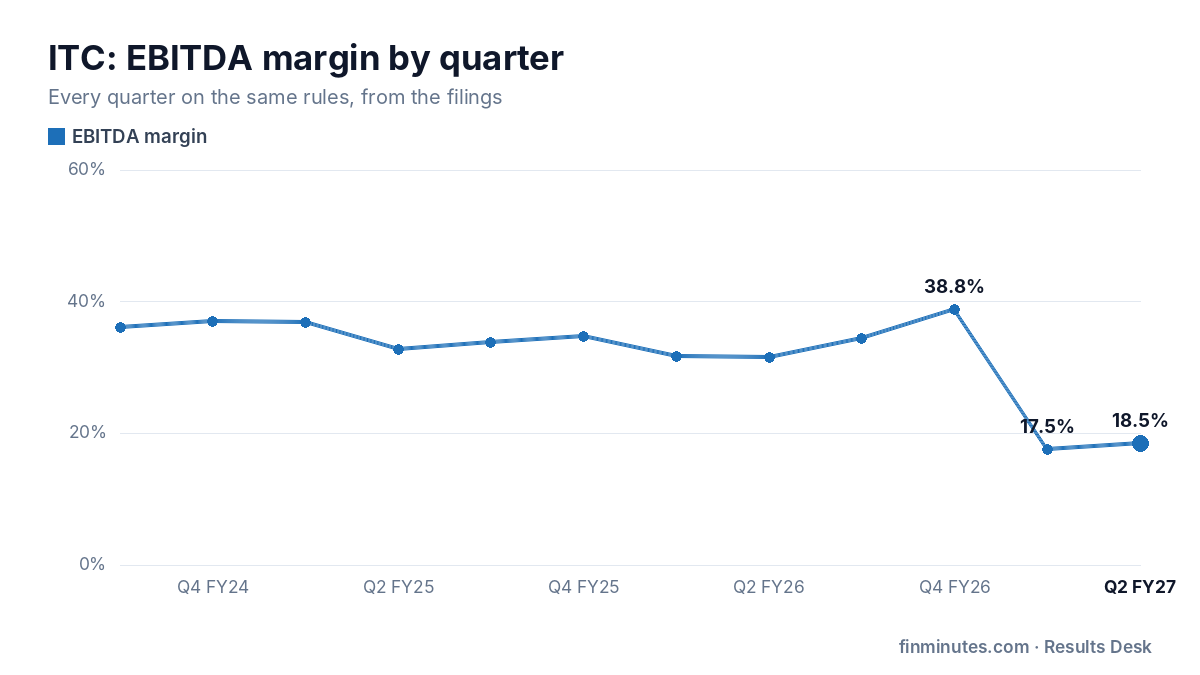
| EBITDA margin | 18.5% | 17.5% | 31.5% | −1,304 bps |
| Net profit | ₹4,229 cr | ₹4,509 cr | ₹5,187 cr | −18.5% |
| EPS | ₹3.32 | ₹3.51 | ₹4.09 | −18.8% |
Consolidated figures in ₹ crore, as filed with the exchanges.
What the numbers say
Operating profit (EBITDA) was ₹5,645 cr, a margin of 18.5%, −1,304 bps on the year and +91 bps on the quarter. Over the last 8 quarters the margin has ranged from 17.5% to 38.8%, averaging 30.1%. Operating costs grew +71.2%, faster than revenue at +43.9%, so operating profit grew less than sales.
Net profit was ₹4,229 cr, −18.5% on the year and −6.2% on the quarter, with earnings per share of ₹3.32. Profit before other income, one-offs and tax fell 17.3%, so the profit growth came from the business itself. The tax rate of 26% is in line with its recent average. Profit over the last four quarters totals ₹19,226 cr, −45.6% on the four before.
ITC Ltd. is a Nifty 50 company. Of the 19 Nifty 50 companies reported so far, the median profit growth is +15.5%; ITC Ltd.'s −18.5% puts it below that.
FMCG growth splits into volume and price. When margins rise while revenue grows slowly, the cause is usually easier input costs rather than stronger demand.
On earnings per share of ₹15.07 over the last four quarters, the stock at ₹262.25 trades at 17.4 times trailing earnings.
Where the profit change came from
Net profit went from ₹5,187 cr in Sep '25 to ₹4,229 cr in Sep '26. Taking each line in turn: Business (EBITDA) took away ₹1,050 cr, depreciation took away ₹55.8 cr, finance cost took away ₹18.2 cr, other income took away ₹77.0 cr, exceptional items took away ₹114 cr, tax added ₹327 cr and other lines added ₹30.6 cr.
Segments
| Segment | Revenue | YoY | Result | YoY |
|---|---|---|---|---|
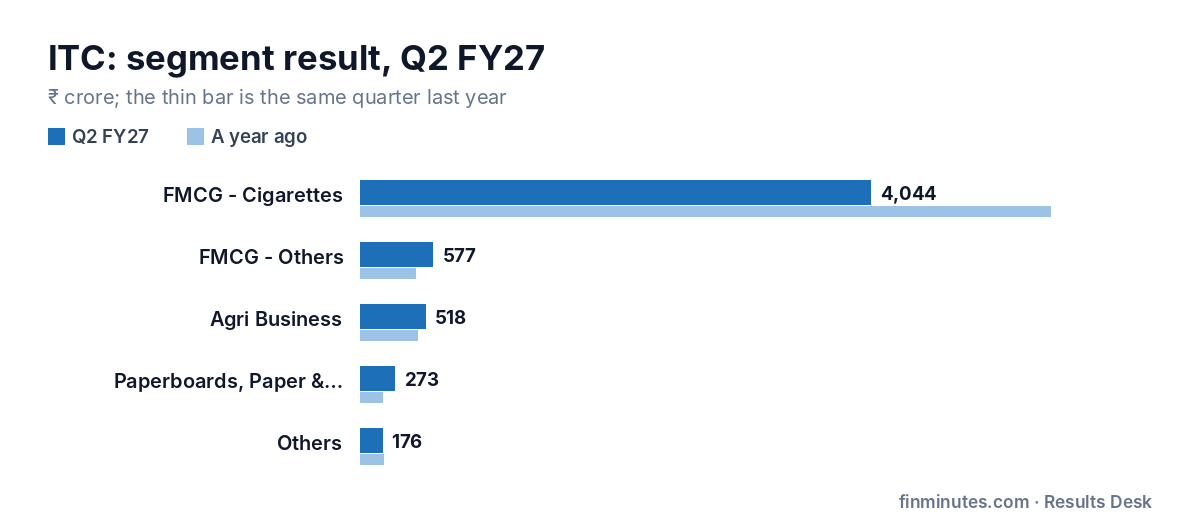
| FMCG – Cigarettes | ₹16,237 cr | +72.5% | ₹4,044 cr | −26.0% |
| FMCG – Others | ₹7,218 cr | +19.1% | ₹577 cr | +31.4% |
| Agri Business | ₹4,551 cr | +12.7% | ₹518 cr | +14.3% |
| Paperboards, Paper & Packaging | ₹3,017 cr | +35.9% | ₹273 cr | +50.7% |
| Others | ₹1,450 cr | +16.5% | ₹176 cr | −3.6% |
Questions the numbers raise
- Operating margin fell sharply on the year. Pricing, input costs, or mix? EBITDA margin 18.5%, −1,304 bps on the year (+91 bps on the quarter).
Each is a question with its numbers, not a finding of wrongdoing. The results page shows the source for each one.
What to watch next
For a company in FMCG, the numbers to watch are underlying volume growth, gross margin and rural against urban demand.
The next quarter, Q3 FY27, has to be filed by 14 Feb 2027. The same checks will run on it, and the results page will compare it with this one.
All of ITC's quarters, the checks and the profit bridge →
The ITC terminal: financials, valuation history and forensic checks →
Frequently asked questions
What were ITC Ltd. Q2 FY27 results?
ITC Ltd. reported revenue of ₹30,578 cr (+43.9% on the year) and net profit of ₹4,229 cr (−18.5% on the year) for July to September 2026.
Was ITC Ltd. profit growth driven by the core business?
Profit before other income, exceptional items and tax moved −17.3% on the year, against −18.5% for reported profit.
Are there any red flags in ITC Ltd. Q2 FY27 results?
1 check raised a question: Operating margin fell sharply on the year. Pricing, input costs, or mix?
Is this a recommendation?
No. FinMinutes reports what was filed and the questions the numbers raise. It does not recommend buying, selling or holding any security.
Numbers as filed with the exchanges, read by published rules. FinMinutes is a financial data and analytics platform; nothing here is a recommendation to buy, sell or hold any security.

Leave a Reply