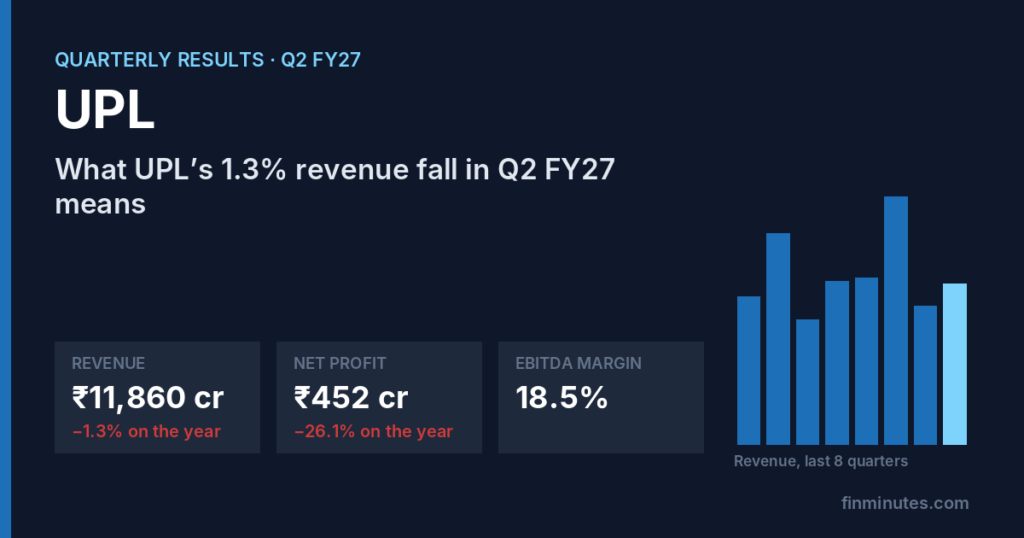
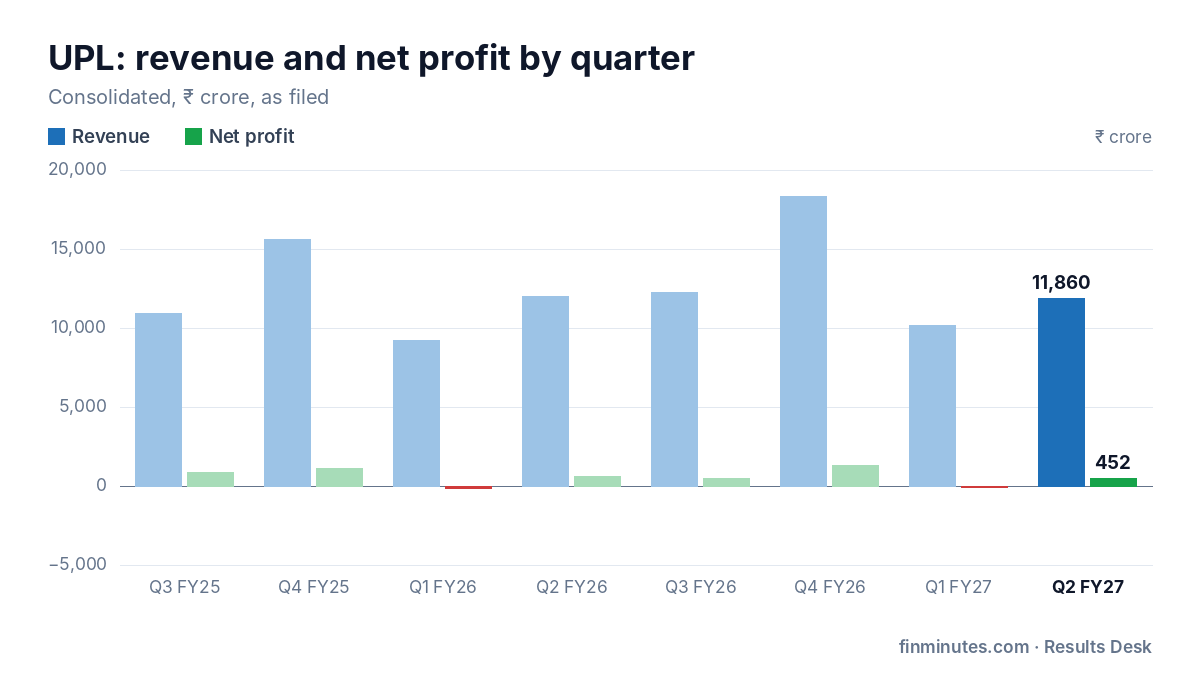
UPL Ltd. reported revenue of ₹11,860 cr for July to September 2026, −1.3% on the year and +16.5% on the quarter. That is slower than this quarter has grown in recent years (+8.7% on average). Over the last four quarters revenue comes to ₹52,645 cr, +10.3% on the four before.
The full UPL Q2 FY27 results page carries every quarter on the same rules, the checks that ran and the ones that need the filing read: UPL Q2 FY27 results, read forensically.
UPL Q2 FY27: the numbers
| Sep '26 | Previous quarter | A year ago | On the year | |
|---|---|---|---|---|
| Revenue | ₹11,860 cr | ₹10,181 cr | ₹12,019 cr | −1.3% |
| EBITDA | ₹2,200 cr | ₹1,450 cr | ₹2,001 cr | +9.9% |
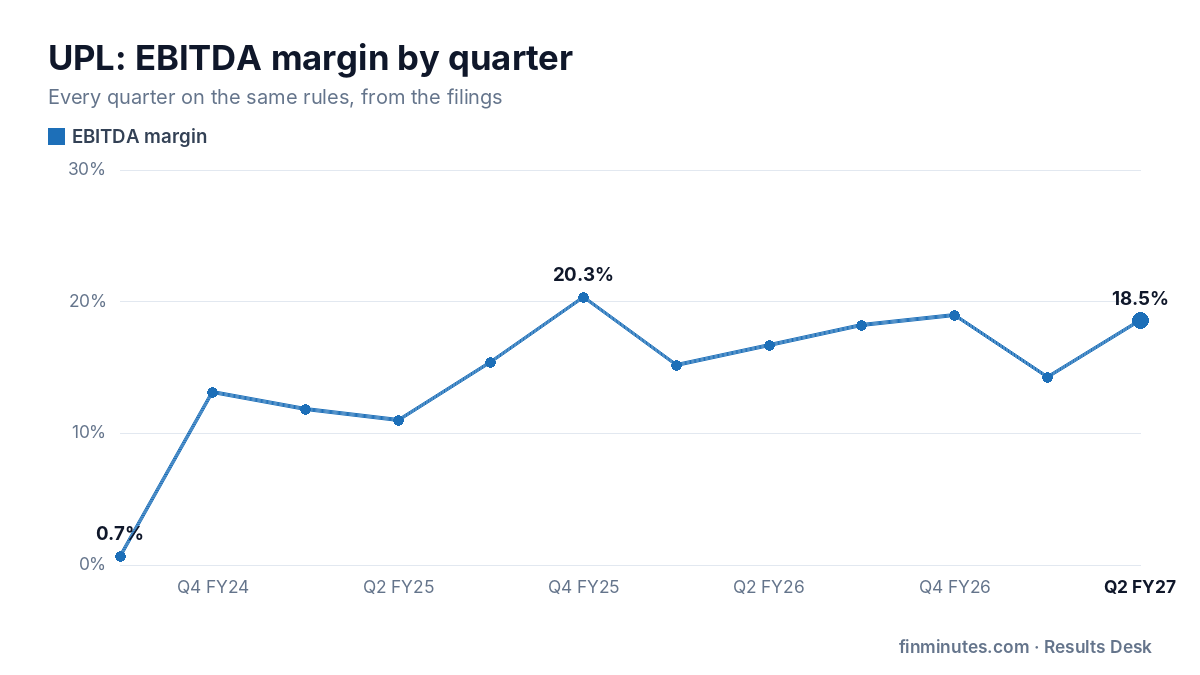
| EBITDA margin | 18.5% | 14.2% | 16.6% | +190 bps |
| Net profit | ₹452 cr | −₹73.0 cr | ₹612 cr | −26.1% |
| EPS | ₹4.99 | ₹0.12 | ₹6.75 | −26.1% |
Consolidated figures in ₹ crore, as filed with the exchanges.
What the numbers say
Operating profit (EBITDA) was ₹2,200 cr, a margin of 18.5%, +190 bps on the year and +431 bps on the quarter. Over the last 8 quarters the margin has ranged from 14.2% to 20.3%, averaging 17.2%. Operating costs grew −3.6% against revenue growth of −1.3%, so more of each rupee of sales reached operating profit.
Net profit was ₹452 cr, −26.1% on the year and — on the quarter, with earnings per share of ₹4.99. Profit before other income, one-offs and tax fell 36.7%, so 11 points of the headline growth came from outside the core business. The tax rate of 27% is in line with its recent average. Profit over the last four quarters totals ₹2,163 cr, −8.7% on the four before.
Agri inputs are seasonal and move with the monsoon and with subsidy payments, so quarters are best compared with the same quarter a year earlier.
On earnings per share of ₹22.38 over the last four quarters, the stock at ₹534.65 trades at 23.9 times trailing earnings.
Where the profit change came from
Net profit went from ₹612 cr in Sep '25 to ₹452 cr in Sep '26. Taking each line in turn: Business (EBITDA) added ₹199 cr, depreciation took away ₹48.0 cr, finance cost took away ₹35.0 cr, other income took away ₹64.0 cr, exceptional items added ₹143 cr, tax added ₹9.0 cr and other lines took away ₹364 cr.
What the company says drove it
- Consolidated Q2 FY27 Revenue (₹11,860 crore, -1% YoY) down: 10% volume decline in global crop protection offset by 9% positive currency contribution and double-digit growth in Advanta and Superform.
- Consolidated Q2 FY27 EBITDA (₹2,312 crore, +5% YoY) up: Margin expansion of 120 bps to 19.5% from improved product/platform mix, brand strength, and SG&A cost optimization.
- Superform Revenue Q2 FY27 (₹3,579 crore, +28% YoY) up: Driven by 50% growth in specialty chemicals (33% volume, 17% price) and active ingredient price pass-through (+21%).
- Superform EBIT Q2 FY27 (₹323 crore, +39% YoY) up: Driven by price realization, higher share of specialty chemicals (29% vs 25%), and strong lubricant contract manufacturing.
- UPL Corp Q2 FY27 Revenue (₹7,972 crore, -8% YoY) down: Impacted by 16% volume decline and 2% price decline due to tight LATAM grower credit, European heatwave, and cautious buying.
- Advanta Q2 FY27 Revenue (₹1,875 crore, +12% YoY) up: Driven by field corn in Argentina, LATAM, and Indonesia, sunflower and grain sorghum in Argentina, and post-harvest growth.
- UPL SAS H1 FY27 EBITDA (₹553 crore, +20% YoY) up: Driven by 430 bps margin expansion to 26.8% from 9% price realization and 80% growth in hyper-scale brands.
- Net Working Capital Days Q2 FY27 (145 days, +27 days YoY) up: Driven by a 16-day increase in inventory days from higher input costs, lower crop volumes, and H2 inventory build-up.
Segments
| Segment | Revenue | YoY | Result | YoY |
|---|---|---|---|---|
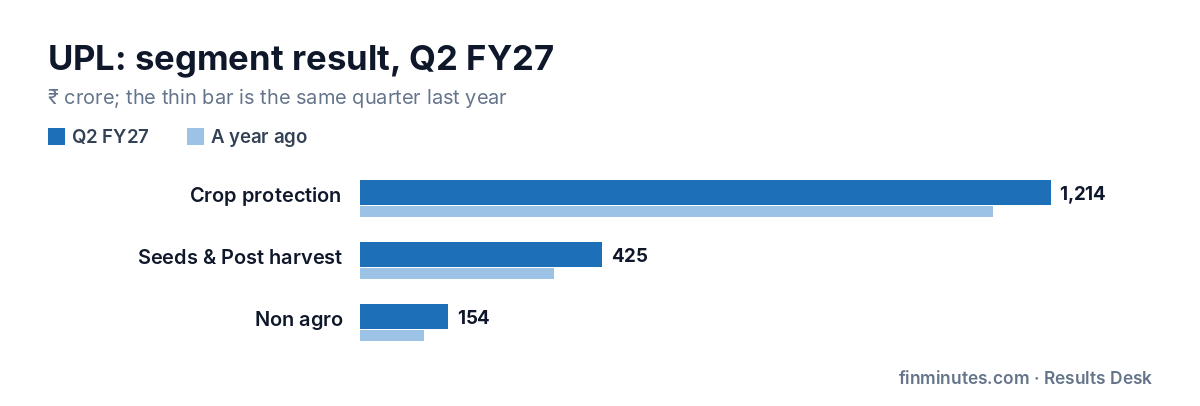
| Crop protection | ₹9,034 cr | −7.2% | ₹1,214 cr | +9.1% |
| Seeds & Post harvest | ₹1,858 cr | +10.9% | ₹425 cr | +24.6% |
| Non agro | ₹1,060 cr | +61.8% | ₹154 cr | +38.7% |
The operating numbers
Platform Revenue Performance (Q2 FY27) (₹ crore)
| This quarter | YoY | |
|---|---|---|
| Superform (Manufacturing & Specialty Chemicals) | 3579.00 | +28.0% |
| UPL Corp (Global Crop Protection) | 7972.00 | −8.0% |
| UPL SAS (India Crop Protection) | 921.00 | +1.0% |
| Advanta (Seeds & Post-Harvest) | 1875.00 | +12.0% |
Source: transcript p.13, 14, 16, 18
Platform EBITDA / EBIT Performance (Q2 FY27) (₹ crore)
| This quarter | YoY | |
|---|---|---|
| Superform EBIT | 323.00 | +39.0% |
| UPL Corp EBITDA | 1083.00 | — |
| UPL SAS EBITDA | 214.00 | +3.0% |
| Advanta EBITDA | 510.00 | +19.0% |
Source: transcript p.14, 16, 17, 19
Questions the numbers raise
- Profit with no operating cash behind it. Where did the cash go? Operating cash flow for the first half −₹9,587 cr against profit of ₹379 cr.
- Inventory is piling up against sales. Slow demand, or stocking ahead? Inventory at 167 days of sales, against 89 days at the last year end (₹20,165 cr now, ₹12,676 cr then).
- Receivables grew much faster than sales. Who has not paid, and why? Receivables at 154 days of sales, against 129 days at the last year end (₹18,638 cr now, ₹18,343 cr then).
Each is a question with its numbers, not a finding of wrongdoing. The results page shows the source for each one.
What to watch next
For a company in Agriculture, fertilisers and agrochemicals, the numbers to watch are volumes, the monsoon and subsidy receivables.
The next quarter, Q3 FY27, has to be filed by 14 Feb 2027. The same checks will run on it, and the results page will compare it with this one.
All of UPL's quarters, the checks and the profit bridge →
The UPL terminal: financials, valuation history and forensic checks →
Frequently asked questions
What were UPL Ltd. Q2 FY27 results?
UPL Ltd. reported revenue of ₹11,860 cr (−1.3% on the year) and net profit of ₹452 cr (−26.1% on the year) for July to September 2026.
Was UPL Ltd. profit growth driven by the core business?
Profit before other income, exceptional items and tax moved −36.7% on the year, against −26.1% for reported profit.
Are there any red flags in UPL Ltd. Q2 FY27 results?
3 checks raised a question: Profit with no operating cash behind it. Where did the cash go?
Is this a recommendation?
No. FinMinutes reports what was filed and the questions the numbers raise. It does not recommend buying, selling or holding any security.
Numbers as filed with the exchanges, read by published rules. FinMinutes is a financial data and analytics platform; nothing here is a recommendation to buy, sell or hold any security.

Leave a Reply