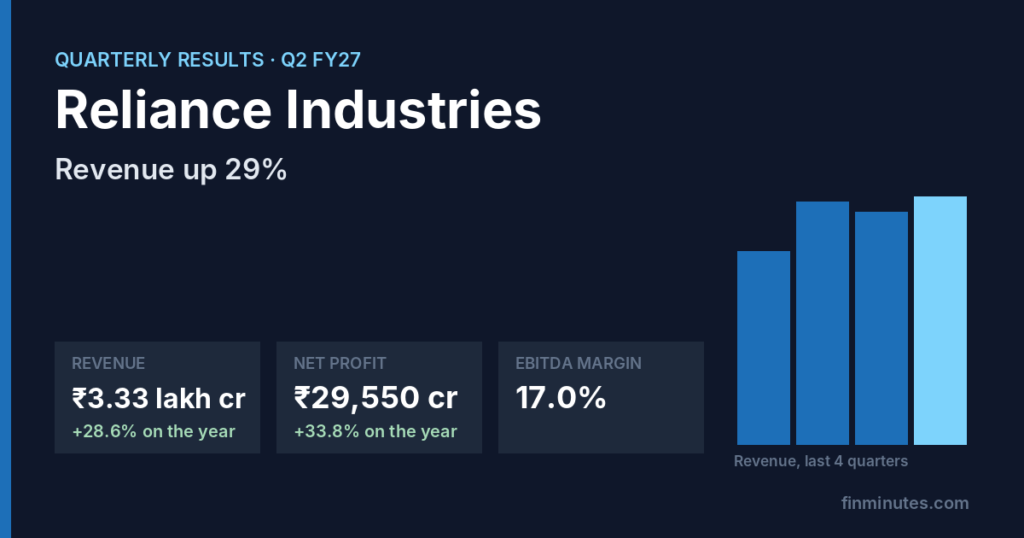
Reliance Industries Ltd. reported revenue of ₹3.33 lakh cr for July to September 2026, +28.6% on the year and +6.7% on the quarter.
The full Reliance Industries Q2 FY27 results page carries every quarter on the same rules, the checks that ran and the ones that need the filing read: Reliance Industries Q2 FY27 results, read forensically.
Reliance Industries Q2 FY27: the numbers
| Sep '26 | Previous quarter | A year ago | On the year | |
|---|---|---|---|---|
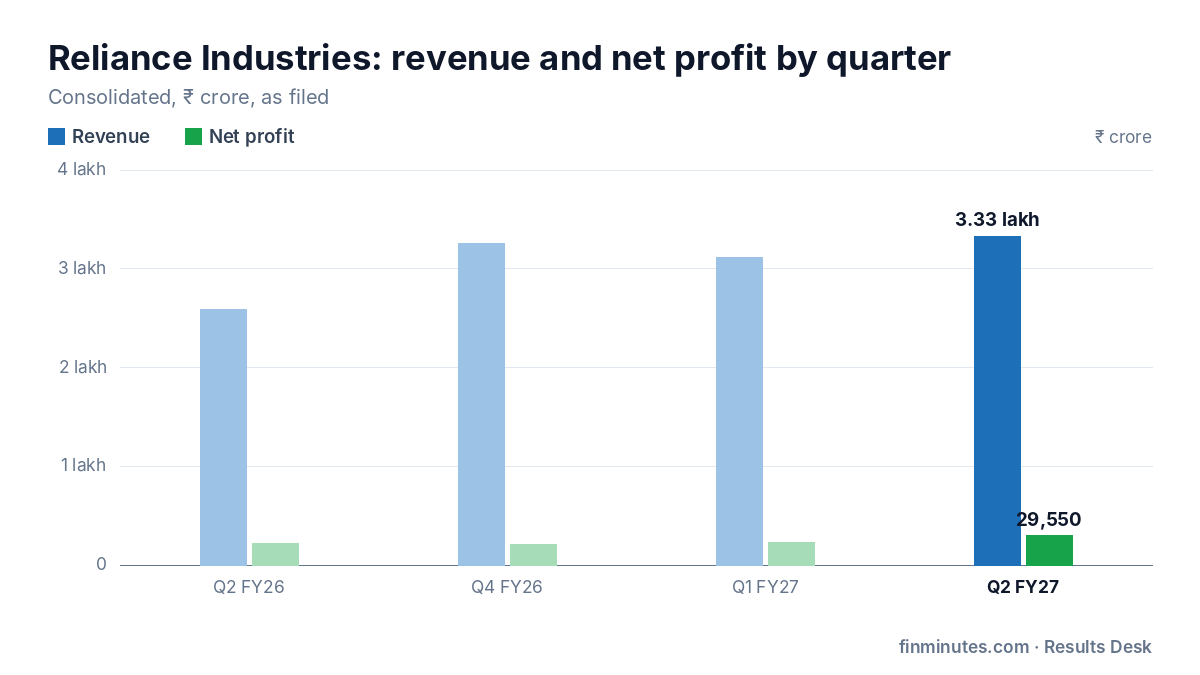
| Revenue | ₹3.33 lakh cr | ₹3.12 lakh cr | ₹2.59 lakh cr | +28.6% |
| EBITDA | ₹56,616 cr | ₹47,517 cr | ₹45,885 cr | +23.4% |
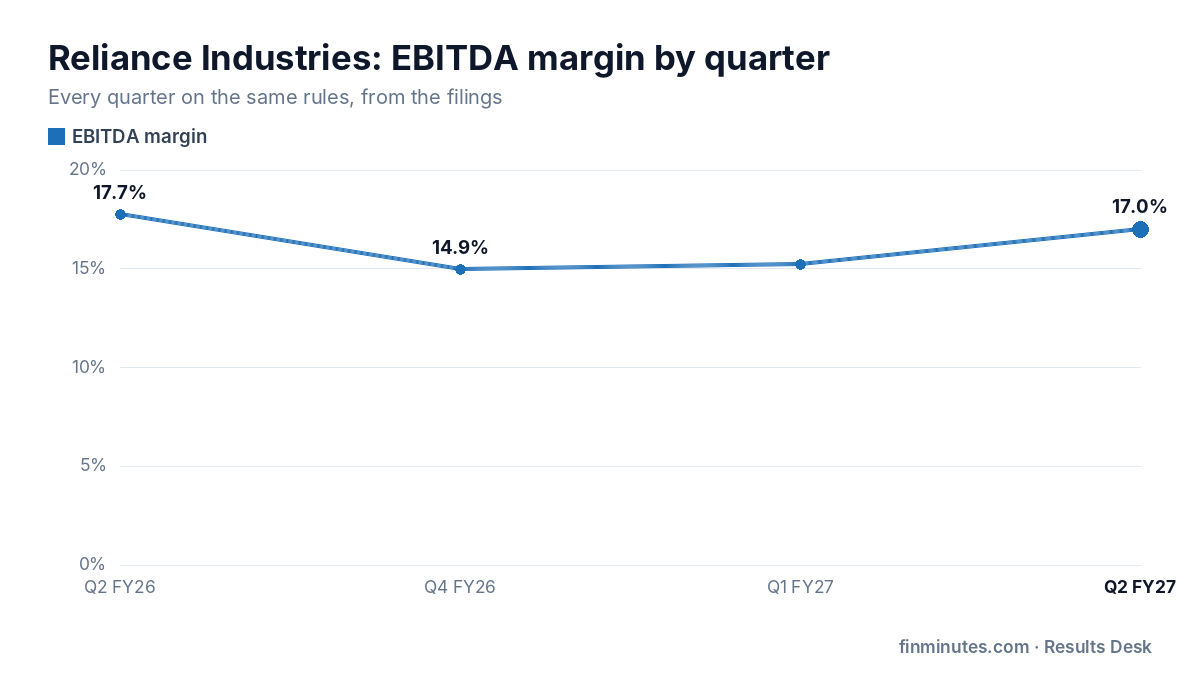
| EBITDA margin | 17.0% | 15.2% | 17.7% | −71 bps |
| Net profit | ₹29,550 cr | ₹23,196 cr | ₹22,092 cr | +33.8% |
| EPS | ₹18.88 | ₹15.48 | ₹13.42 | +40.7% |
Consolidated figures in ₹ crore, as filed with the exchanges.
What the numbers say
Operating profit (EBITDA) was ₹56,616 cr, a margin of 17.0%, −71 bps on the year and +177 bps on the quarter. Operating costs grew +29.7%, faster than revenue at +28.6%, so operating profit grew less than sales.
Net profit was ₹29,550 cr, +33.8% on the year and +27.4% on the quarter, with earnings per share of ₹18.88. Profit before other income, one-offs and tax grew 33.2%, so the profit growth came from the business itself.
Of the 5 companies in Oil, gas and energy that have reported Q2 FY27 so far, Reliance Industries Ltd. ranks 3rd on revenue growth; the sector median is +30.7%. Its margin moved −71 bps on the year against a sector median of −337 bps.
Reliance Industries Ltd. is a Nifty 50 company. Of the 16 Nifty 50 companies reported so far, the median profit growth is +16.0%; Reliance Industries Ltd.'s +33.8% puts it above that.
Refining and marketing profits swing with crude and product margins, and inventory gains or losses can move a single quarter sharply.
Where the profit change came from
Net profit went from ₹22,092 cr in Sep '25 to ₹29,550 cr in Sep '26. Taking each line in turn: Business (EBITDA) added ₹10,731 cr, depreciation took away ₹899 cr, finance cost took away ₹1,654 cr, other income added ₹1,311 cr, tax took away ₹2,385 cr and other lines added ₹354 cr.
Segments
| Segment | Revenue | YoY | Result | YoY |
|---|---|---|---|---|
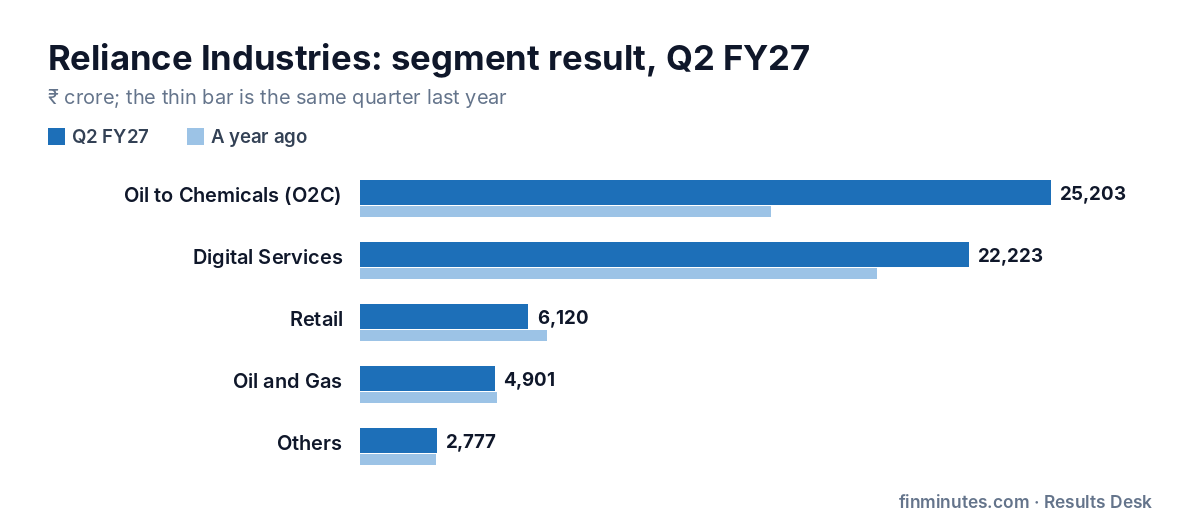
| Oil to Chemicals (O2C) | ₹2.32 lakh cr | +44.2% | ₹25,203 cr | +67.9% |
| Oil and Gas | ₹6,020 cr | −0.6% | ₹4,901 cr | −2.0% |
| Retail | ₹91,717 cr | +1.3% | ₹6,120 cr | −10.2% |
| Digital Services | ₹48,486 cr | +11.2% | ₹22,223 cr | +17.7% |
| Others | ₹25,317 cr | +56.2% | ₹2,777 cr | +0.2% |
Questions the numbers raise
None of the 15 checks that could run on this quarter raised a question. That says the numbers cleared these checks; it is not a verdict on the company.
How it compares with Oil, gas and energy this season
| Company | Revenue growth | Margin change | Profit growth |
|---|---|---|---|
| Bharat Petroleum Corporation Ltd. | +42.1% | −328 bps | −21.5% |
| Adani Total Gas Ltd. | +34.1% | −345 bps | +3.1% |
| Reliance Industries Ltd. | +28.6% | −71 bps | +33.8% |
| Castrol India Ltd. | +27.3% | −860 bps | −22.8% |
| Aegis Logistics Ltd. | −3.5% | +693 bps | +31.1% |
What to watch next
For a company in Oil, gas and energy, the numbers to watch are refining margins, throughput and inventory gains or losses.
The next quarter, Q3 FY27, has to be filed by 14 Feb 2027. The same checks will run on it, and the results page will compare it with this one.
All of Reliance Industries' quarters, the checks and the profit bridge →
The Reliance Industries terminal: financials, valuation history and forensic checks →
Frequently asked questions
What were Reliance Industries Ltd. Q2 FY27 results?
Reliance Industries Ltd. reported revenue of ₹3.33 lakh cr (+28.6% on the year) and net profit of ₹29,550 cr (+33.8% on the year) for July to September 2026.
Was Reliance Industries Ltd. profit growth driven by the core business?
Profit before other income, exceptional items and tax moved +33.2% on the year, against +33.8% for reported profit.
Are there any red flags in Reliance Industries Ltd. Q2 FY27 results?
None of the 15 checks that could run raised a question.
Is this a recommendation?
No. FinMinutes reports what was filed and the questions the numbers raise. It does not recommend buying, selling or holding any security.
Numbers as filed with the exchanges, read by published rules. FinMinutes is a financial data and analytics platform; nothing here is a recommendation to buy, sell or hold any security.


Leave a Reply