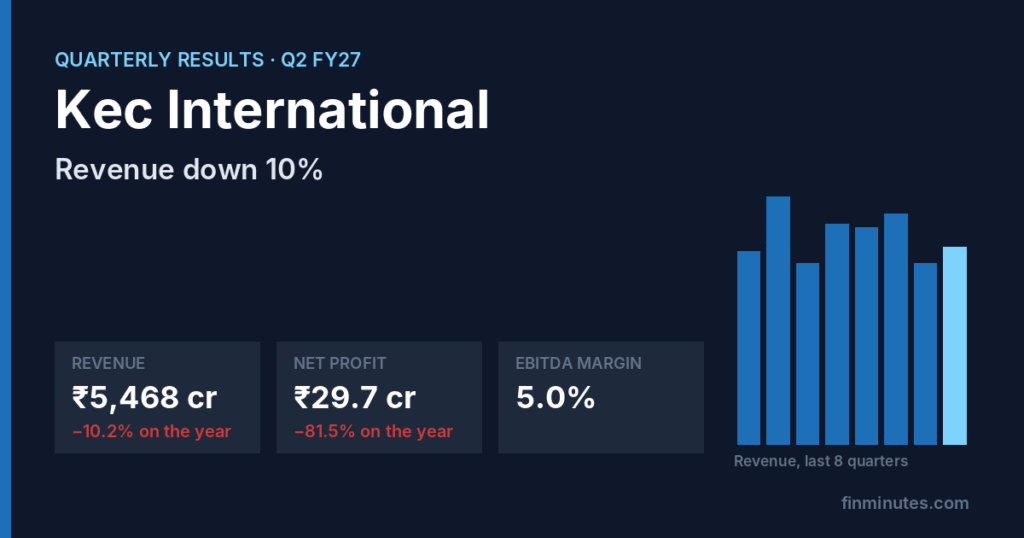
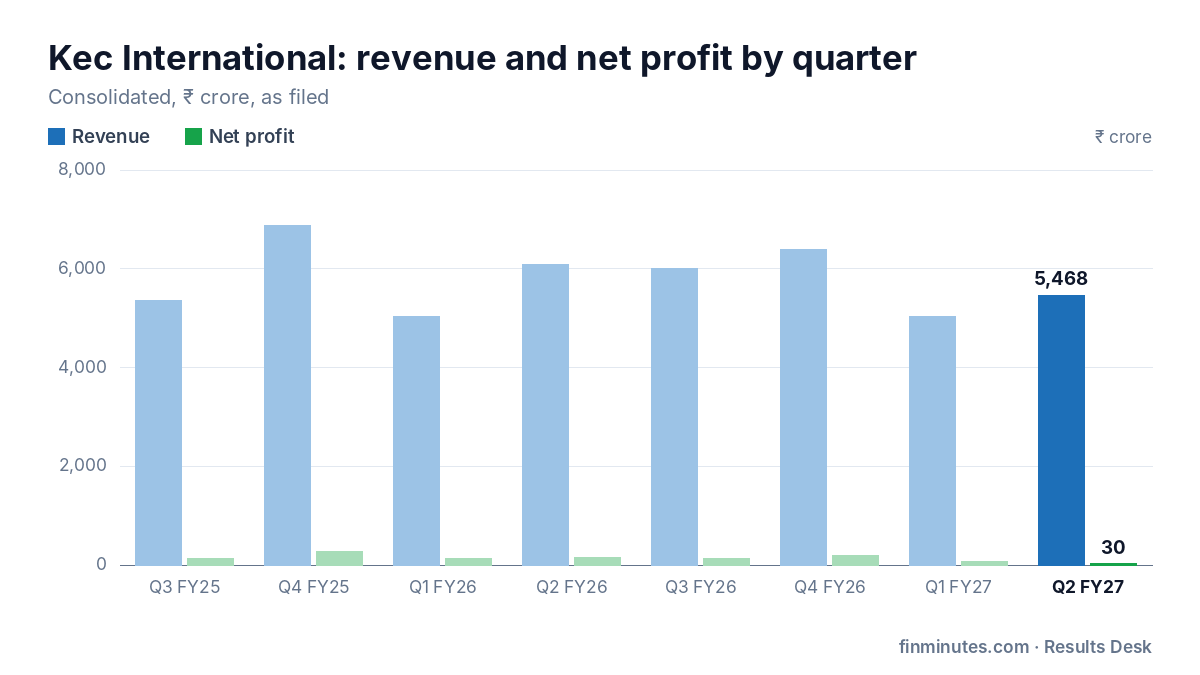
Kec International Ltd. reported revenue of ₹5,468 cr for July to September 2026, −10.2% on the year and +8.8% on the quarter. That is slower than this quarter has grown in recent years (+16.4% on average). Over the last four quarters revenue comes to ₹22,882 cr, −1.9% on the four before.
The full Kec International Q2 FY27 results page carries every quarter on the same rules, the checks that ran and the ones that need the filing read: Kec International Q2 FY27 results, read forensically.
Kec International Q2 FY27: the numbers
| Sep '26 | Previous quarter | A year ago | On the year | |
|---|---|---|---|---|
| Revenue | ₹5,468 cr | ₹5,024 cr | ₹6,092 cr | −10.2% |
| EBITDA | ₹271 cr | ₹291 cr | ₹430 cr | −37.0% |
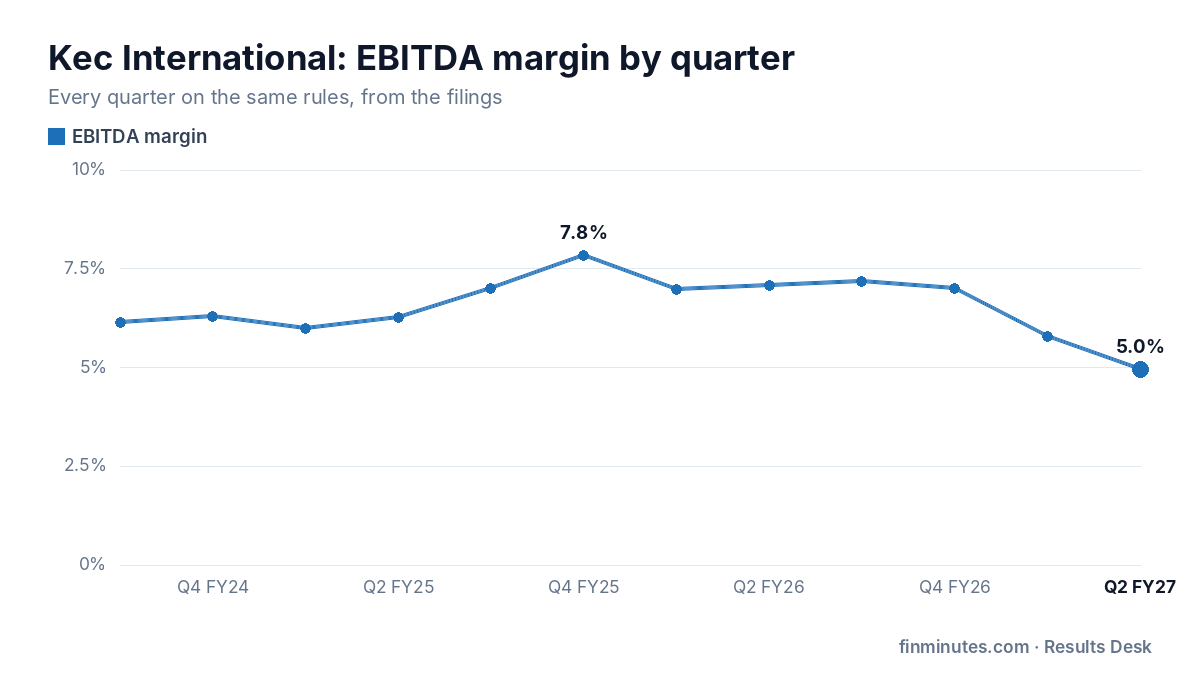
| EBITDA margin | 5.0% | 5.8% | 7.1% | −210 bps |
| Net profit | ₹29.7 cr | ₹72.6 cr | ₹161 cr | −81.5% |
| EPS | ₹1.12 | ₹2.73 | ₹6.04 | −81.5% |
Consolidated figures in ₹ crore, as filed with the exchanges.
What the numbers say
Operating profit (EBITDA) was ₹271 cr, a margin of 5.0%, −210 bps on the year and −83 bps on the quarter. It is the narrowest margin of the last 8 quarters (range 5.0% to 7.8%). Operating costs grew −8.2%, faster than revenue at −10.2%, so operating profit grew less than sales.
Net profit was ₹29.7 cr, −81.5% on the year and −59.0% on the quarter, with earnings per share of ₹1.12. Profit before other income, one-offs and tax fell 86.7%, so 5 points of the headline growth came from outside the core business. The tax rate was 27% against an average of 22% over the previous 8 quarters, which weighed on profit this quarter. Profit over the last four quarters totals ₹422 cr, −38.2% on the four before.
Of the 3 companies in Real estate, REITs and InvITs that have reported Q2 FY27 so far, Kec International Ltd. ranks 3rd on revenue growth; the sector median is +11.3%. Its margin moved −210 bps on the year against a sector median of +370 bps.
Real estate revenue is booked when projects complete, so the quarterly statements lag the business; pre-sales and collections show where it actually is.
On earnings per share of ₹15.88 over the last four quarters, the stock at ₹352.65 trades at 22.2 times trailing earnings.
Where the profit change came from
Net profit went from ₹161 cr in Sep '25 to ₹29.7 cr in Sep '26. Taking each line in turn: Business (EBITDA) took away ₹159 cr, depreciation took away ₹2.4 cr, finance cost took away ₹19.2 cr, other income added ₹8.6 cr and tax added ₹41.1 cr.
Segments
| Segment | Revenue | YoY | Result | YoY |
|---|---|---|---|---|
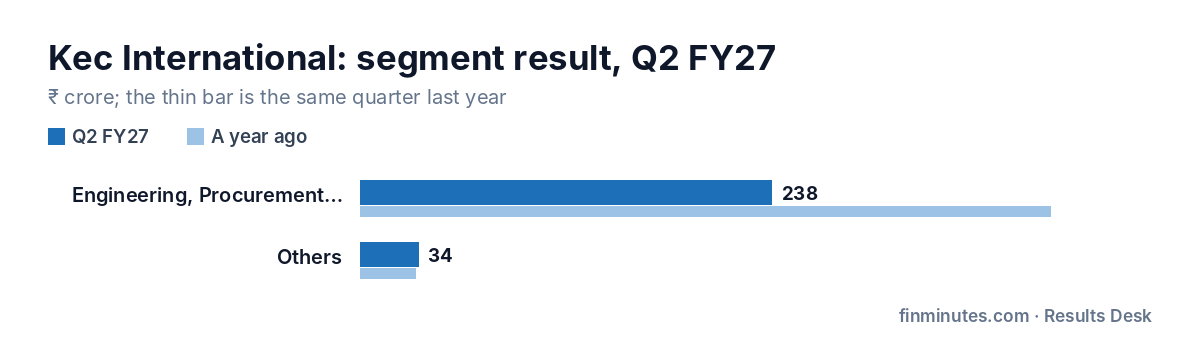
| Engineering, Procurement and Construction business | ₹4,941 cr | −13.5% | ₹238 cr | −40.3% |
| Others | ₹613 cr | +17.0% | ₹33.6 cr | +4.6% |
Questions the numbers raise
- The auditor drew attention to a matter in the limited review report. Read it before the numbers. “We draw attention to Note 6 to the consolidated financial results regarding an investigation by a government agency, who has filed a chargesheet and the Court has taken cognizance of…”
- Other income is carrying a large and rising share of profit. Treasury gains, interest, or one-off? Other income was 32% of profit before tax, against 2% a year earlier.
Each is a question with its numbers, not a finding of wrongdoing. The results page shows the source for each one.
How it compares with Real estate, REITs and InvITs this season
| Company | Revenue growth | Margin change | Profit growth |
|---|---|---|---|
| Lodha Developers Ltd. | +17.6% | +412 bps | +28.3% |
| Anant Raj Ltd. | +4.9% | +328 bps | +13.0% |
| Kec International Ltd. | −10.2% | −210 bps | −81.5% |
What to watch next
For a company in Real estate, REITs and InvITs, the numbers to watch are pre-sales, collections and launches.
The next quarter, Q3 FY27, has to be filed by 14 Feb 2027. The same checks will run on it, and the results page will compare it with this one.
All of Kec International's quarters, the checks and the profit bridge →
The Kec International terminal: financials, valuation history and forensic checks →
Frequently asked questions
What were Kec International Ltd. Q2 FY27 results?
Kec International Ltd. reported revenue of ₹5,468 cr (−10.2% on the year) and net profit of ₹29.7 cr (−81.5% on the year) for July to September 2026.
Was Kec International Ltd. profit growth driven by the core business?
Profit before other income, exceptional items and tax moved −86.7% on the year, against −81.5% for reported profit.
Are there any red flags in Kec International Ltd. Q2 FY27 results?
2 checks raised a question: The auditor drew attention to a matter in the limited review report. Read it before the numbers.
Is this a recommendation?
No. FinMinutes reports what was filed and the questions the numbers raise. It does not recommend buying, selling or holding any security.
Numbers as filed with the exchanges, read by published rules. FinMinutes is a financial data and analytics platform; nothing here is a recommendation to buy, sell or hold any security.

Leave a Reply