Reprinting the headline revenue and net profit figures from an initial public offering document is straightforward, but it rarely reveals the operational reality of the business. For an entity like Laser Power & Infra Limited, navigating a capital-intensive sector with multi-year project horizons, the true operational trajectory is found within the notes to the accounts, the cash conversion statements, and the contingent liability schedules.
This financial analysis provides a forensic reading of the Laser Power Infra IPO financials, extracting and evaluating the numbers from the audited, restated consolidated financial statements to understand the asset quality, working capital pressures, and balance sheet flags.
The Core Financial Profile: Headline Performance Data
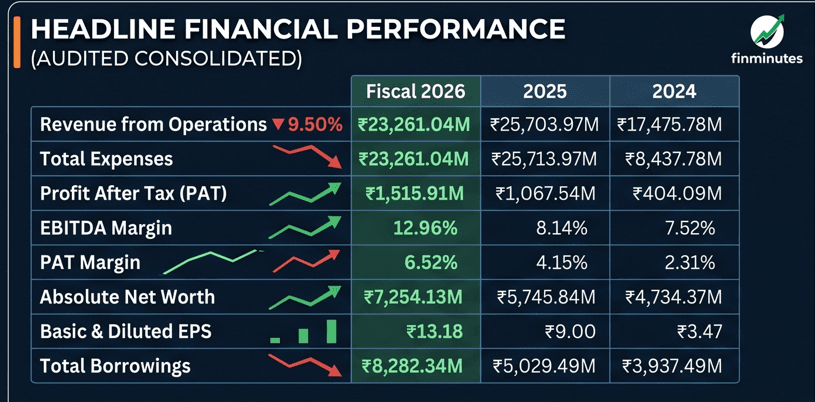
Before examining the footnotes, it is necessary to establish the baseline trajectories of the headline income statement. The table below compiles the core consolidated metrics across the three disclosed financial tracking cycles:
Laser Power & Infra Limited: Consolidated Financial Summary
| Audited Financial Parameter | Fiscal 2026 (₹ Millions) | Fiscal 2025 (₹ Millions) | Fiscal 2024 (₹ Millions) |
| Revenue from Operations | 23,261.04 | 25,703.97 | 17,475.78 |
| Total Expenses | 21,870.33 | 24,543.88 | 17,096.04 |
| Profit After Tax (PAT) | 1,515.91 | 1,067.54 | 404.09 |
| EBITDA (Calculated) | 3,014.28 | 2,092.58 | 1,314.91 |
| EBITDA Margin (%) | 12.96% | 8.14% | 7.52% |
| PAT Margin (%) | 6.52% | 4.15% | 2.31% |
| Absolute Net Worth | 7,254.13 | 5,745.84 | 4,734.37 |
| Basic & Diluted EPS (₹) | 13.18 | 9.00 | 3.47 |
| Total Borrowings | 8,282.34 | 5,029.49 | 3,937.49 |
Headline Performance Analysis: Revenue Contraction vs Margin Expansion
The full-year financial statements for the period ending March 31, 2026, show a significant divergence between top-line volume and internal profitability metrics. Laser Power & Infra revenue profit trajectories indicate that operating revenue contracted by 9.50% over the last fiscal year, sliding from ₹25,703.97 million in Fiscal 2025 down to ₹23,261.04 million in Fiscal 2026. This reverses the previous top-line expansion of 47.08% seen between Fiscal 2024 and Fiscal 2025. Over the entire three-year tracking cycle, revenue from operations grew at a two-year compounded annual growth rate (CAGR) of 15.35%.
This top-line contraction was reportedly driven by a strategic shift away from low-margin low-tension (LT) cables toward higher-margin high-tension (HT) cables.
Despite this top-line slowdown, the company’s operating efficiency metrics experienced a substantial surge. The EBITDA margin, which measures earnings before interest, taxes, depreciation, and amortisation, reflecting basic operational performance, expanded by 482 basis points over the last year, climbing from 8.14% in Fiscal 2025 to 12.96% in Fiscal 2026.
Concurrently, Profit After Tax (PAT) net margins increased from 4.15% to 6.52%, with absolute net profits growing by 41.99% to reach ₹1,515.91 million in Fiscal 2026. Reported basic and diluted earnings per share (EPS) followed a similar upward trajectory, moving from ₹3.47 in Fiscal 2024 and ₹9.00 in Fiscal 2025 to stand at ₹13.18 per share by the close of the last financial year.
Quality of Earnings: Working Capital Stress and Cash Flow Tracking
A forensic accounting review requires evaluating whether the net profits reported on an accrual basis are being converted into actual liquidity. In capital-intensive manufacturing and EPC frameworks, a divergence between net profits and operating cash flows can point to underlying financial friction.
Asset and Credit Elongation Metrics
The primary driver of balance sheet pressure for Laser Power is the continuous lengthening of its credit cycles. Based on the printed operational ratios, the company’s collection timelines have faced significant stress:
- Trade Receivable Allocation: As of March 31, 2026, absolute trade receivables reached ₹13,749.57 million, representing a substantial 59.11% of total revenue from operations for that year.
- Collection Cycles (Receivable Days): The credit collection duration expanded significantly to 196 days in Fiscal 2026, up from 135 days in Fiscal 2025 and 145 days in Fiscal 2024, indicating that an increasing portion of operating assets remains tied up as uncollected balances with utility clients.
            CASH CONVERSION CYCLE FRICTION (FISCAL 2026)

     Inventory Storage Period          : [████████████] 84 Days
   + Trade Receivable Credit Window    : [─────────────────────────────────] 196 Days
   ─────────────────────────────────────────────────────────────────────────────
   = Gross Working Capital Exposure    : 280 Days
   - Trade Payable Deferred Window     : [█████████████] 121 Days
   ─────────────────────────────────────────────────────────────────────────────
   = Net Cash Conversion Stress Period : 159 Days
This asset lockup is further visible in inventory requirements. Absolute inventories stood at ₹5,637.95 million at the close of Fiscal 2026, translating to an average storage window of 84 days. When combined with the receivable lag, the gross asset cycle spans 280 days before accounting for trade payable deferrals.
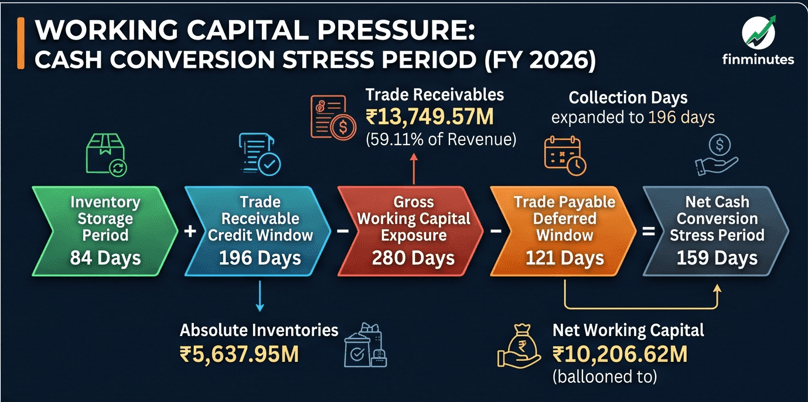
Laser Power has partially responded to this by extending its payment windows with its own suppliers, shifting Trade Payable Days out to 121 days in Fiscal 2026. However, the absolute Net Working Capital required to support operations ballooned to ₹10,206.62 million in Fiscal 2026, meaning that a substantial portion of earnings is absorbed by working capital requirements rather than generating positive cash from operations.
Valuation Multiples: Factual Peer Comparisons
To assess how Laser Power’s financial results are valued relative to the broader market, the printed multiples can be compared with listed corporate peers operating in the same power cables and infrastructure segments.
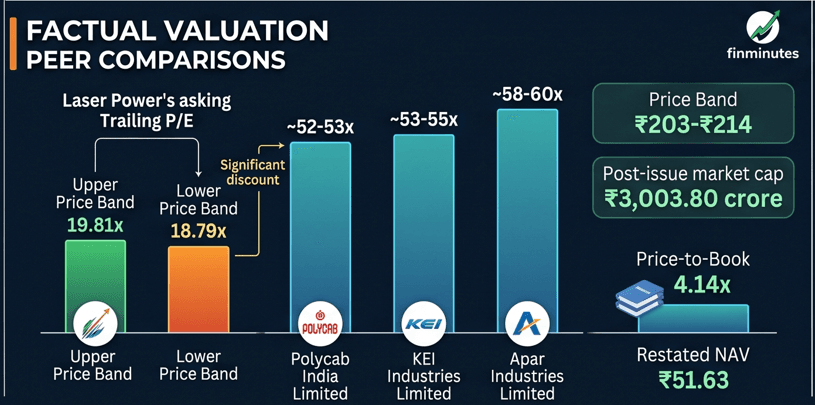
At the upper bounds of the specified price band of ₹214, the enterprise has an asking trailing Price-to-Earnings (P/E) multiple of 19.81x on its Fiscal 2026 net profit of ₹1,515.91 million (based on a post-issue market capitalisation of ₹3,003.80 crore). At the lower bounds of the price band (₹203), the trailing P/E multiple sits at 18.79x.
According to latest market benchmarks, major listed peers in the wires, cables, and conductor industries trade at significantly higher valuation metrics:
- Polycab India Limited: Trailing P/E commands a multiple of ~52x to 53x.
- KEI Industries Limited: Trailing P/E commands a multiple of ~53x to 55x.
- Apar Industries Limited: Trailing P/E commands a multiple of ~58x to 60x.
Laser Power’s printed Price-to-Book (P/B) multiple sits at 4.14x against its restated net asset value (NAV) of ₹51.63 per share.
The Footnotes: Examining Contingent Liabilities and Balance Sheet Flags
The core of a Laser Power Infra IPO financial analysis lies within the conditional schedules, transaction disclosures, and legal appendices. These notes reveal several key financial obligations and structural dependencies.
1. Contingent Liabilities Breakdown
As of March 31, 2026, Laser Power Infra carried a total contingent liability layer of ₹267.83 million. Measured as an arithmetic observation against the disclosed absolute net worth of ₹7,254.13 million, these unprovisioned claims represent approximately 3.69% of the company’s equity base. The primary components include:
            CONTINGENT LIABILITY EXPOSURE (₹ 267.83 MILLION)

   ┌─────────────────────────────────────────────────────────┐
   │  GST Demand Orders (ITC Discrepancies)  : ₹ 35.22M      │
   ├─────────────────────────────────────────────────────────┤
   │  Unsecured Factoring Lines (SBI Factors): ₹ 131.83M     │
   ├─────────────────────────────────────────────────────────┤
   │  Product Performance Guarantees         : ₹ 100.78M     │
   └─────────────────────────────────────────────────────────┘
- Unsecured Factoring Obligations: The largest component sits under “Other money for which Laser power is contingently liable,” amounting to ₹131.83 million. This represents a trade receivable financing line backed by a limit of ₹800.00 million from SBI Global Factors Limited, secured via a subordinate charge on the present and future assets of the firm.
- Disputed GST Demand Notices: The company carries demand orders totalling ₹35.22 million under Section 74 of the Central Goods and Services Act, 2017. These demands, issued by tax authorities for Fiscals 2018 and 2019, concern alleged discrepancies in Input Tax Credit claims and are currently being contested through writ petitions before the Patna High Court.
- Defect Liability Guarantees: The firm holds an active corporate guarantee layer of ₹100.78 million issued directly to commercial customers to cover product performance obligations during defined warranty periods.
2. Related-Party Transaction Intensity
Note 47.9 reveals significant transaction volumes between Laser Power Infra Limited and other entities controlled by the promoter group. In Fiscal 2026, the company recorded:
- Material Purchases: Laser Power purchased goods and services valued at ₹181.62 million from Ceebuild Company Private Limited, representing 0.78% of its operating revenue base. It also purchased products worth ₹89.97 million from G.M. Dalui & Sons Private Limited and ₹258.32 million from its recently divested entity, UIC Udyog Limited.
- Asset Leasing and Rental Structures: The firm paid ₹42.24 million in rent to Devesh Buildcon Private Limited, an enterprise where key promoters exercise significant influence.
- Executive Commissions: Chairman and Managing Director Deepak Goel received ₹104.00 million as a direct commission on sales in Fiscal 2026, accounting for 0.45% of total revenue.
3. Auditor Emphasis of Matter and Borrowing Restrictions
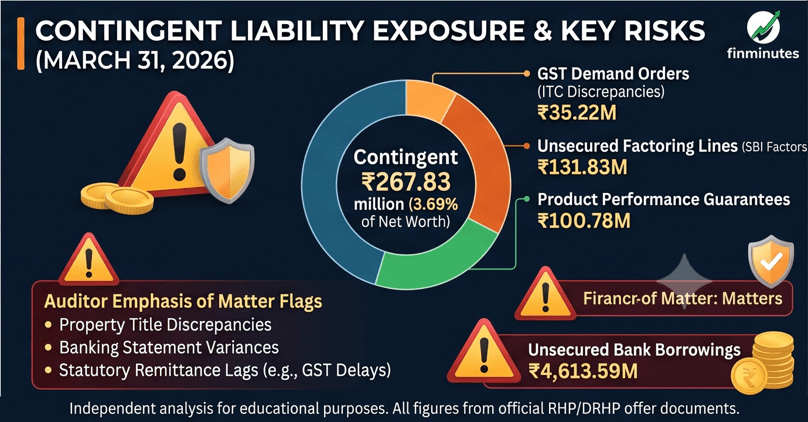
The independent examination reports compiled by statutory auditors V. Singhi & Associates contain an Emphasis of Matter paragraph outlining several key items:
- Property Title Discrepancies: Gaps remain regarding the clear registration and traceability of formal title deeds for specific immovable properties held on the balance sheet.
- Banking Statement Variances: Historical quarterly working capital data summaries submitted directly to credit banks showed variances when cross-referenced against the final books of accounts.
- Statutory Remittance Lags: The company has experienced delays in remitting undisputed statutory dues, including Goods and Services Tax (GST) and Tax Deducted at Source (TDS). Tracking data shows GST payment delays across 24 distinct instances in Fiscal 2026, spanning 5 to 256 days.
Use of Proceeds: Balance Sheet Restructuring
The incoming fresh capital from the Laser Power Infra IPO is structured primarily to modify the company’s debt profile rather than funding new field projects. Out of the ₹5,420.00 million Fresh Issue allocation, the management has committed ₹4,900.00 million strictly to pay down outstanding bank debt.
This debt retirement targets short-term, floating-rate borrowings, which include high-interest unsecured lines like a short-term loan from HDFC Bank Limited and an unsecured facility from ICICI Bank Limited. While this allocation reduces immediate debt servicing requirements, the prospectus confirms that these debt-reduction plans have not been independently appraised by any commercial banking agency or financial institution.
Evaluating the Financial Position: Key Variables for Investors
A final assessment of Laser Power Infra Limited’s financial position requires balancing its clear bottom-line expansion against its tight cash cycles.
Positive Variables
- Profitability Momentum: Net profit grew by 41.99% in FY26, with the operational EBITDA margin expanding to 12.96% due to a richer product mix.
- Debt Reduction Plan: Allocating ₹4,900.00 million of fresh IPO proceeds to pay down short-term debt will deleverage the balance sheet and reduce finance costs.
- Relative Valuation Discount: The company’s asking trailing P/E multiple (~19.8x) sits at a significant discount relative to the multiples (52x to 60x) commanded by larger listed peers.
Risk Variables
- Severe Receivable Capital Lockup: The cash conversion cycle faces stress, with receivable collection delays stretching out to 196 days in Fiscal 2026.
- Unsecured Loan Exposure: Laser Power carries ₹4,613.59 million in short-term unsecured bank borrowings that are repayable on demand, creating refinancing risks if macro credit conditions tighten.
- Auditor Observations: The repeated Emphasis of Matter references regarding banking statement variances and tax compliance lags point to historical gaps in internal financial controls.
The final evaluation of these financials depends on whether the post-IPO reduction in interest expenses will provide the company with enough internal liquidity to manage its long collection cycles without relying on further debt.
Financial FAQ Section
Is Laser Power & Infra Limited a profitable company?
Yes. Audited consolidated statements show that Laser Power reported a net profit (PAT) of ₹1,515.91 million for Fiscal 2026, up from ₹1,067.54 million in Fiscal 2025 and ₹404.09 million in Fiscal 2024.
What are the main contingent liabilities on Laser Power’s balance sheet?
As of March 31, 2026, the company had total contingent liabilities of ₹267.83 million. This includes ₹131.83 million in unsecured receivable factoring arrangements with SBI Global Factors and ₹35.22 million in disputed GST demand notices concerning Input Tax Credit claims.
Why is there a gap between Laser Power’s revenue and profit trends in FY26?
While FY26 revenue declined by 9.50% to ₹23,261.04 million, net profit increased by 42% due to a strategic operational shift away from low-margin low-tension (LT) cables toward higher-margin high-tension (HT) cables and overhead conductors, which expanded overall EBITDA margins.
What are the main auditor flags in the company’s financial statements?
Statutory auditors V. Singhi & Associates included an Emphasis of Matter highlighting gaps in matching quarterly bank statements to the main ledger, multiple instances of delays in remitting statutory tax dues, and specific untraceable title documents for immovable properties.
The Takeaway
Laser Power & Infra is coming to the market at a trailing P/E of 19.8x, which is a severe discount compared to the 52x–60x multiples commanded by its large-cap peers.
However, this discount is not a “free lunch.” The market is pricing in the structural differences: Polycab and KEI have deep consumer-facing (B2C) retail networks and robust cash flows, whereas Laser Power & Infra is heavily B2B (government utilities), carrying massive working capital stress (135 receivable days), and holding a large sum of unsecured debt that can be recalled on demand.
You get the discount, but you absorb the balance-sheet friction.
This article is independent financial analysis for educational and informational purposes only. It is not investment advice and not a recommendation to apply for, buy, sell, or hold any security. All figures are drawn from the company’s own offer document (DRHP/RHP) and are sourced within; verify against the final prospectus before making any decision. Investments in securities are subject to market risks, including possible loss of principal. Consult a qualified, registered financial adviser regarding your specific circumstances.



Leave a Reply