1. Executive Summary & Issue Architecture
LIC OFS: The Government of India (acting through the Ministry of Finance / DIPAM) has initiated the largest secondary market divestment in Indian capital markets history by offering up to a 6.5% equity stake in Life Insurance Corporation of India (LIC) via the Stock Exchange Mechanism (OFS).
Unlike a traditional Initial Public Offering (IPO) that injects primary growth capital into a business, an OFS is a pure secondary transfer of shares from existing promoters to public investors. Not a single rupee raised in this ~₹31,400 crore issue will accrue to LIC’s balance sheet; 100% of the proceeds flow directly to the national exchequer’s disinvestment purse.
Live OFS Issue Structure & Key Metrics
| Parameter | Live OFS Specification | Forensic Significance |
|---|---|---|
| Issuer Company | Life Insurance Corporation of India (LIC) | Sovereign-backed life insurance market leader. |
| Seller | President of India (Ministry of Finance / DIPAM) | Sovereign promoter holding 96.50% pre-OFS. |
| Base Offer Size | 2.00% to 2.50% (~12.65 to 15.81 crore shares) | Guaranteed base supply hitting exchange order books. |
| Greenshoe Option | 4.00% to 4.50% (~25.30 to 28.46 crore shares) | Oversubscription absorption capacity. |
| Maximum Dilution | 6.50% (~82.22 crore total shares) | Rises public float from 3.50% to 10.00%. |
| Floor Price | ₹382 per equity share | Set at a ~10% discount to pre-announcement close (₹424.35). |
| Retail / Employee Discount | ₹15 per share on the discovered clearing price | Brings effective retail floor price down to ₹367/share. |
| Total Estimated Issue Size | ~₹31,000 to ₹31,410 Crore ($3.7+ Billion) | Absorbs massive system liquidity across domestic/global funds. |
| T-Day (Institutional Window) | August 4, 2026 (Non-Retail / QIB / NII) | Discovers the actual institutional clearing price. |
| T+1 Day (Retail & Employee) | August 5, 2026 (Retail / Employee / Unfilled QIB) | Bids placed at Cut-Off or specific price with ₹15 discount. |
| Retail Quota Allocation | Minimum 10% of total offer size (~8.22 crore shares) | Protected allocation pool under SEBI OFS rules. |
2. The Supply Overhang & MPS Trajectory
The primary structural driver behind this OFS is regulatory compliance, not strategic corporate restructuring. Under SEBI’s Minimum Public Shareholding (MPS) mandate, every listed entity on Indian bourses must maintain a public float of at least 25% within statutory timelines.
[LIC Public Float Progression]
Pre-IPO (May 2022):       0.0% Public Float  | 100.0% Promoter (GOI)
Post-IPO (2022 - 2026):   3.5% Public Float  |  96.5% Promoter (GOI)
Post-OFS (August 2026):  10.0% Public Float  |  90.0% Promoter (GOI)  <-- Current Milestone
Statutory MPS Target:    25.0% Public Float  |  75.0% Promoter (GOI)  <-- Remaining Overhang
The 15% Dilution Dam
By executing a 6.5% divestment, the government successfully elevates LIC’s public float from 3.5% to exactly 10.0%. This satisfies SEBI’s intermediate statutory milestone ahead of the May 16, 2027, deadline.
However, from an institutional and forensic standpoint, an additional 15.0% equity dilution (~189 crore shares) still stands between LIC and the ultimate 25% statutory MPS threshold.
- The Overhang Cap Effect: Large sovereign overhangs historically act as a ceiling on secondary market share price appreciation. Whenever the stock experiences a fundamental re-rating or technical rally, market participants anticipate another government OFS tranche, triggering preemptive selling.
- The “Moratorium” Caveat: While DIPAM has indicated informal assurances to institutional investors that no further share sales will occur for 3 to 4 years after this 10% milestone is achieved, verbal or informal guidance does not supersede statutory SEBI listing obligations unless a formal, gazetted exemption is granted by the Ministry of Finance.
3. Forensic Flag: Floor Price Mechanics & The Discount Illusion
Pricing an OFS requires balancing immediate execution certainty against the risk of secondary market disruption. The government fixed the floor price at ₹382 per share, which represented a ~10% discount to Monday’s closing price of ₹424.35.
The Arbitrage Bleed & Intraday Price Discovery
Within hours of the OFS announcement, LIC’s secondary market stock price experienced an immediate ~7.2% downward correction, trading toward the ₹390–₹397 zone. This behaviour is a textbook demonstration of OFS Arbitrage Convergence:
- Institutional Short-Selling (Cash-Future Arbitrage): Large institutional desks and arbitrageurs short the stock in the F&O market (or sell existing holdings in the secondary cash market) at ₹410–₹420, while simultaneously placing bids in the OFS at or slightly above the ₹382 floor price.
- The Effective Retail Floor: With an explicit ₹ 15-per-share discount for retail investors and eligible employees, the effective minimum entry price for retail bids is ₹367/share.
- The Margin of Safety Audit: While a ₹367 retail entry appears attractive relative to the ₹424 pre-announcement spot price, the true comparative benchmark is not the historical price, but the T-Day Institutional Clearing Price. If institutional demand clears at ₹384, a retail investor bidding at cut-off acquires shares at ₹369 (₹384 minus a ₹15 discount), a ~6% discount to the prevailing secondary market spot price.
4. Actuarial Balance Sheet Audit: Embedded Value (EV) & Margin Quality
Standard corporate valuation metrics (EPS, P/E, EV/EBITDA) fail when analysing life insurance conglomerates. An insurance company’s true economic worth is governed by its Indian Embedded Value (IEV), the sum of its Adjusted Net Worth (ANW) and the Value of In-Force (VIF) business, and its Value of New Business (VNB).
Key Performance Metrics (Latest FY26 Disclosures)
| Metric | Pre-IPO (FY22) | FY25 | FY26 (Latest Report) | Forensic Direction |
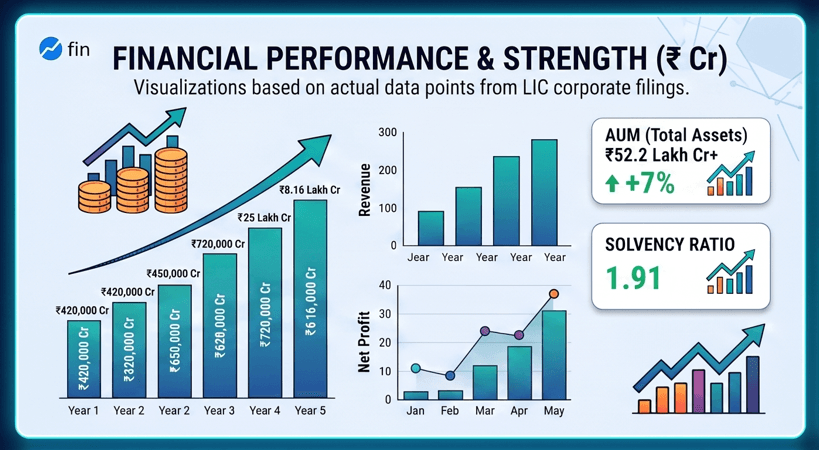
| Assets Under Management (AUM) | $431,553 Mn | $576,022 Mn | $605,297 Mn (~₹59.03 Lakh Cr) | +5.1% YoY Expansion |
| Value of New Business (Net VNB) | $805 Mn | $1,058 Mn | $1,498 Mn | +41.6% Surge |
| Net VNB Margin (%) | 15.1% | 17.6% | 21.2% | +360 bps Expansion YoY |
| Non-Participating Product Share | 29.6% | 53.3% | 60.8% | Major Structural Pivot |
| Indian Embedded Value (IEV) | $57,207 Mn | $82,075 Mn | $83,376 Mn | Compounded Wealth Growth |
| Solvency Ratio (%) | 185.0% | 211.0% | 235.0% | Well above 150% statutory threshold |
| Overall Expense Ratio (%) | 14.50% | 12.42% | 11.91% | Operating Efficiency Gain |
| Gross NPA Ratio (Policyholder Fund) | — | 1.46% | 1.21% | Improving Credit Quality |
Balance Sheet Quality & Operational Efficiency
LIC’s financial statements reflect ongoing structural improvements in cost management and asset quality:
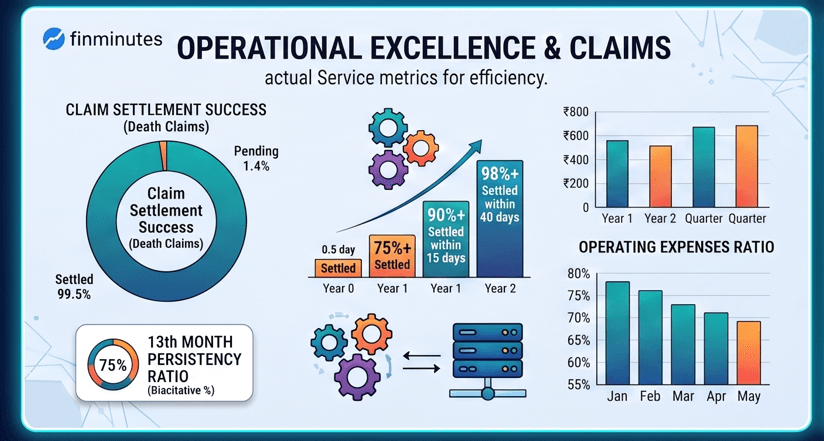
- Expense Ratio Compression: The overall expense ratio declined to 11.91% in FY26 (down from 12.42% in FY25 and 14.50% pre-IPO), driven by automated processing and digitised customer servicing.
- Commission Ratio: Reduced to 4.55% in FY26 (from 5.18% in FY25), reflecting a rising share of direct, group, and bank-led sales.
- Asset Quality (Gross NPA): On the policyholders’ fund, the Gross NPA ratio dropped to 1.21% (down from 1.46% in FY25), demonstrating disciplined corporate bond portfolio provisioning.
- Solvency Cushion: Solvency stands at 235% (vs 211% in FY25), providing a comfortable capital buffer above the IRDAI mandatory minimum of 150%.
Digital Transformation & Project DIVE (Management MD&A Focus)
In the Management Discussion & Analysis section of the Annual Report, LIC leadership highlighted Project DIVE (Digital Innovation and Value Enhancement) as a strategic priority:
- MyLIC App: Re-engineered customer portal rated 4.5/5 on App Stores, enabling self-service policy administration, claims tracking, and direct premium payments.
- LIC Super Sales Saathi App: Intermediary platform rated 4.1/5, providing real-time sales tracking, commission calculations, and automated customer policy monitoring.
- Next-Gen Data Lake & MarTech: Implementation of enterprise Data Lake infrastructure to drive hyper-personalised product cross-selling and automated campaign management.
A. The Par to Non-Par Engine & Margin Expansion
The single most critical structural shift inside LIC’s balance sheet is the intentional migration from Participating (Par) products to Non-Participating (Non-Par) products.
[Individual New Business Premium Mix Evolution]
FY22 (Pre-IPO):   70.4% Par  |  29.6% Non-Par  -->  VNB Margin: 15.1%
FY25:             46.7% Par  |  53.3% Non-Par  -->  VNB Margin: 17.6%
FY26 (Current):   39.2% Par  |  60.8% Non-Par  -->  VNB Margin: 21.2%
Why This Matters Forensically
- Surplus Distribution Economics: Under traditional Par policies, 90% of the contractual surplus goes to policyholders as bonuses, leaving only 10% for shareholders. Non-Par policies allocate 100% of the underwriting surplus directly to shareholders.
- VNB Margin Walk Analysis: As disclosed in LIC’s latest Investor Presentation, the VNB margin expanded from 17.6% to 21.2% in FY26.
- The business mix shift (higher Non-Par volume) contributed +3.0% directly to the margin surge.
- Economic assumption shifts added +3.4%, which was partially offset by operating assumption adjustments (-2.8%).
- Policy Volume vs. Premium Reality: While Non-Par accounts for 60.8% of Individual New Business Premium, it represents only 19.9% of the total number of policies sold (with Par still comprising 80.1% by volume). This indicates that high-ticket, margin-accretive products are being targeted at affluent and HNI customer segments.
B. Distribution Omnichannel & The “Bima Sakhi” Shift
While LIC remains an agency-dominant powerhouse, the distribution mix is undergoing measurable diversification.
[Individual NBP Channel Share]
Channel                    | FY22 (Pre-IPO) | FY25   | FY26 (Latest)
---------------------------|----------------|--------|--------------
Agency Channel             | 96.3%          | 93.9%  | 91.8%
Bancassurance & Alternates | 2.9%           | 5.6%   | 7.5%
Digital & Direct Channels  | 0.8%           | 0.5%   | 0.7%
Crucially, 61.16% of policies and 57.72% of premiums procured by Bima Sakhis originated from rural areas, giving LIC a low-cost distribution engine in underserved geographies.
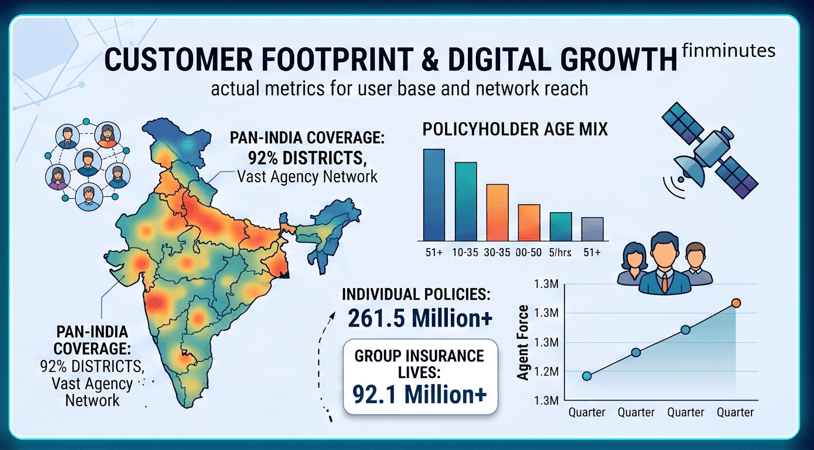
Scale & Coverage: LIC maintains an agency network of ~1.5 million agents (representing 44.3% market share of all life insurance agents in India). The network covers 92% of districts across India (compared to 82% combined for all private insurers).
Bima Sakhi / Mahila Career Agent (MCA) Impact: Highlighted in the FY26 Annual Report and MD&A, the Bima Sakhi initiative has added 0.35 million Mahila Career Agents.
Bima Sakhis generated $300.9 Mn in New Business Premium across 2.19 million policies.
C. The Persistency Ratio “Leaky Bucket”
A critical forensic check for any insurer is whether customers continue paying premiums over time. High initial sales mean nothing if policies lapse by year three.
[Persistency Retention Curve]
13th Month Persistency: ~77% - 79% (Initial retention is stable)
61st Month Persistency: ~49% - 52% (Nearly half of all policies lapse by Year 5)- The Agency Churn Risk: LIC relies on a massive, physically distributed network of over 1.45 million individual agents. While this creates unmatched rural penetration, it also generates structural policy churning, where agents allow older policies to lapse to rewrite new ones for first-year commission incentives.
- A 61st-month persistency ratio near 50% means half of the policies sold five years ago no longer generate renewal premium cash flows, forcing the insurer to constantly acquire new business just to maintain its in-force asset base.
D. Sovereign Capital Misallocation Check
As a state-owned financial institution, LIC has historically served as the “investor of last resort” for government disinvestment initiatives, banking sector recapitalizations, and stressed infrastructure debt.
- Asset Quality & NPA Audit: While sovereign debt holdings (G-Secs) constitute the majority of its fixed-income portfolio, investors must scrutinize the non-performing asset (NPA) provisions within its corporate debt and debenture book.
- Equity Concentration: LIC’s equity portfolio is massive (~$150+ billion in market value), but it carries heavy concentration in cyclical public sector undertakings (PSUs) and systemically sensitive conglomerates. Any macro-level write-down in these holdings directly depresses Adjusted Net Worth (ANW) and Embedded Value.
5. Valuation Deconstruction: Why Does the P/EV Discount Exist?
In the secondary market, LIC has persistently traded at a structural discount to private sector peers on a Price-to-Embedded Value (P/EV) basis.
Comprehensive Valuation & Operational Peer Comparison
| Financial / Actuarial Metric | LIC (OFS Floor Profile) | SBI Life Insurance | HDFC Life Insurance | ICICI Prudential Life | Forensic Interpretation |
|---|---|---|---|---|---|
| Market Share (First Year Premium) | ~58% – 60% | ~9% – 10% | ~7% – 8% | ~5% – 6% | LIC holds dominant scale, but private peers are capturing incremental growth. |
| P/EV Multiple (Trailing) | ~0.68x – 0.75x | 2.10x – 2.30x | 2.60x – 2.90x | 1.70x – 1.90x | LIC trades at a massive ~65% discount to private sector life insurance averages. |
| VNB Margin (%) | 16.5% – 17.2% | 27.5% – 28.5% | 26.0% – 27.0% | 23.0% – 24.5% | Lower Par-heavy product margins depress profitability per rupee of premium. |
| Operating RoEV (%) | 13.5% – 14.8% | 17.5% – 19.0% | 18.0% – 19.5% | 15.5% – 17.0% | Structural efficiency and surplus transfer gap relative to private operators. |
| Distribution Mix | ~95% Agency / 3% Banca | ~30% Agency / 60% Banca | ~20% Agency / 65% Banca | ~25% Agency / 55% Banca | Heavy physical overhead; lacks low-cost, high-volume bank branch distribution. |
| 61st Month Persistency | ~50% – 52% | ~58% – 61% | ~53% – 56% | ~54% – 57% | Higher long-term lapse rates erode the compounded value of the in-force book. |
Is the P/EV Discount a “Value Trap” or a “Re-Rating Opportunity”?
- The Value Trap Argument: The market assigns a ~0.7x P/EV multiple because investors discount LIC for: (1) Sovereign overhang and continuous disinvestment supply; (2) Sub-optimal VNB margins; (3) Absence of a proprietary bank distribution engine (Bancassurance); and (4) Perceived risk of non-commercial capital deployment.
- The Re-Rating Argument: If management successfully scales Non-Par share toward 25%+ of total APE, stabilizes 61st-month persistency above 55%, and SEBI grants a formal, long-term waiver on the remaining 15% MPS dilution, the stock could structurally re-rate toward 1.0x–1.2x P/EV, unlocking substantial capital appreciation from current floor levels.
6. Bidding Mechanics & Playbook for Retail and HNI Investors
An OFS operates as a Two-Stage Separate Window Auction over two consecutive trading days, which is structurally different from an IPO subscription process.
[Two-Stage OFS Bidding Workflow]
T-Day (August 4):   Institutional / Non-Retail Bidding --> Discovers "Clearing Price"
T+1 Day (August 5): Retail & Employee Bidding       --> Bids at "Cut-Off" or Specific Price
A. T-Day: The Institutional Discovery Window (August 4, 2026)
- Who Bids: Qualified Institutional Buyers (QIBs), Mutual Funds, Foreign Institutional Investors (FIIs), and Non-Institutional Investors (NIIs / High Net Worth Individuals bidding > ₹2 Lakhs).
- What to Monitor: Retail investors should ignore raw oversubscription multiples on T-Day and focus entirely on the Indicative Clearing Price.
- Scenario A (Weak Institutional Demand): If the institutional book clears barely at the floor price (₹382–₹383), it indicates institutional reluctance to absorb supply without a steep discount.
- Scenario B (Strong Institutional Demand): If the institutional book clears at ₹390+, it signals strong institutional appetite and establishes a solid secondary market price floor.
B. T+1 Day: The Retail & Employee Window (August 5, 2026)
- Who Bids: Retail investors (bids up to ₹2 Lakhs across all broker accounts) and Eligible Employees.
- The Cut-Off Bidding Advantage: Retail investors have the option to bid at the “Cut-Off Price”. By selecting Cut-Off, the investor agrees to purchase shares at whatever clearing price was determined by institutions on T-Day, minus the ₹15 per share discount.
- Allocation Mathematics: At least 10% of the offer size (~8.22 crore shares) is reserved exclusively for retail investors. If the retail quota is undersubscribed, unsubscribed shares spill back over to institutional bidders. If oversubscribed, allotment is made on a proportionate basis across valid retail bids.
C. HNI / NII Strategy (> ₹2 Lakhs Allocation)
Investors seeking to deploy more than ₹2 lakh cannot participate in the T+1 retail window with the ₹15 discount. They must bid on T-Day (August 4) under the Non-Retail/NII category.
- Unlike IPOs where HNI allotments are lottery-based or proportionate at a fixed band, OFS non-retail bids are allocated based on price priority (multiple clearing prices or single clearing price depending on exchange notice terms). Bidding too close to the ₹382 floor price risks zero allotment if institutional demand pushes the clearing price higher.
7. Summary Risk Matrix & Forensic Checklist
For systematic decision-making, the core structural arguments surrounding the LIC OFS are synthesized below:
========================================================================================
                          FORENSIC CHECKLIST: LIC OFS ISSUE
========================================================================================

[POSITIVE STRUCTURAL CATALYSTS]
 (+) Deep Floor Price Discount: Floor price of ₹382 + ₹15 retail discount provides a
     significant margin of safety against pre-OFS secondary market trading levels.
 (+) Market Leadership & Scale: Untouchable ~58-60% market share in first-year premiums
     with $600B+ in Assets Under Management (AUM).
 (+) Non-Par Surplus Pivot: Ongoing product shift toward high-margin term and ULIP
     products is steadily driving VNB margin expansion.
 (+) Regulatory Milestone Achieved: Successfully elevates public float to 10%,
     satisfying SEBI's immediate May 2027 statutory threshold.

[NEGATIVE FORENSIC FLAGS]
 (-) Structural Supply Overhang: An additional 15% statutory dilution (~189 crore shares)
     remains required to reach SEBI's 25% MPS norm, capping aggressive multiples.
 (-) Sub-Par VNB Margins (~17%): Drastically lower operational profitability compared
     to private peers (~27%) due to a legacy Par-heavy policy book.
 (-) Leaky Persistency Bucket: 61st-month persistency hovering near ~50% indicates
     high long-term customer attrition and agency churning.
 (-) Distribution Structural Handicap: Heavy reliance on physical agency network (95%)
     with minimal low-cost Bancassurance penetration.
========================================================================================
Final Analytical Summary
The LIC Offer for Sale represents a classic Capital Efficiency vs. Overhang Risk structural trade-off. While the ₹382 floor price combined with a ₹15 retail discount establishes an attractive valuation entry point (~0.7x P/EV) relative to private life insurance peers, the persistent long-term statutory requirement to disinvest an additional 15% equity over the coming years remains the primary governing variable for multi-year capital appreciation.
DISCLAIMER: This document is strictly an informational forensic analysis and educational deconstruction of an ongoing secondary market corporate action. Under SEBI (Research Analyst) Regulations, this report contains no buy, sell, hold, or subscribe recommendations, nor does it provide a target price. Investors must consult a SEBI-registered financial advisor before executing any trade.




Leave a Reply