Headline index Nifty 50 is in a downtrend and recently broke below some important levels. Now, the question is, will the fall deepen? Nifty Today started the day with more than 100 points fall, then recovered to trade almost flat for some time, swinging between red and green, but then fell to a day low again, and a small recovery to close.
Now, the question is what will be Nifty’s direction going ahead? To answer that uniquely, I will explore every possibility from options data to Nifty technical to the strength of its core stocks to get the complete picture, so stay tuned.
Nifty on a daily (1D) chart is trading below its important moving averages. It recently broke below the 200-day exponential moving average situated at 23,680. Its 50-day E moving average is at 24,103, and its 21-day E moving average is at 23,866.
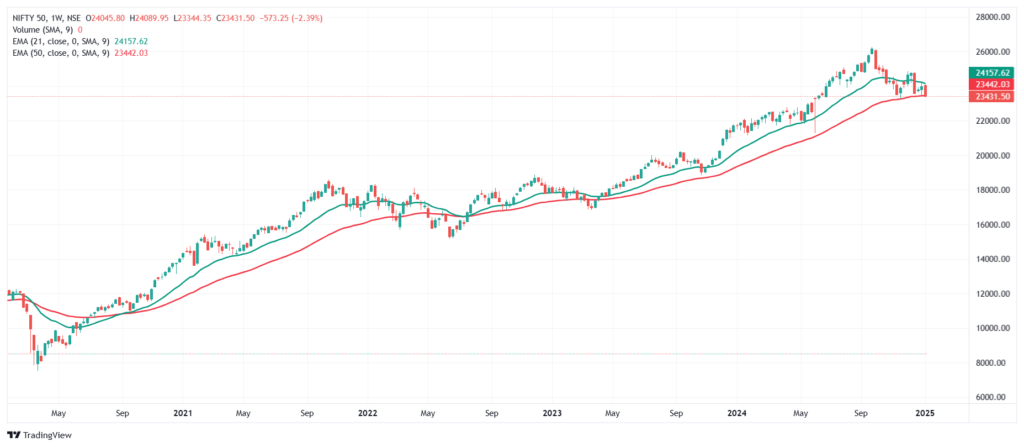
On the weekly chart, though the Nifty is below the 21-day EMA, which is at 24,166 but it is still above the 50-day EMA at close to 24,400. The significance of 21 and 50-day EMA is huge, both for traders and investors, as Nifty often respects it.

21 and 50-day EMA on the weekly chart
These EMAs are used to identify trends and potential buy or sell signals. The 21-day EMA is a short-term EMA that is often used for swing trading. It can signal trend shifts and price respects it during trends. On the other hand, a 50-day EMA is a popular swing-trading EMA that’s a good play between short and long term, and it is often used by long-term investors.
On a standalone basis, these EMAs often work as support and resistance that underlying assets often respect, and when combined, they work as an excellent signal to take trades. When 21 DEMA crosses over 50 d EMA, it is considered a strong bullish signal and called a golden crossover (a chart pattern that indicates a potential upward trend in the market. It occurs when a short-term moving average (SMA) crosses above a long-term moving average (LMA).
Similarly, when 21d EMA crosses below 50d EMA, it is considered a bearish move and known as a dead cross ( a chart pattern that indicates a short-term moving average has crossed below a long-term moving average).
In the last 5 years, since the COVID fall, Nifty has not seen any dead cross of 21 and 50d EMA despite breaking 50d EMA twice, so expectations are that this time Nifty will respect that, and the dead cross will not happen.

I will also take into consideration how much Nifty can fall if it closes below 50d EMA on the weekly chart. Luckily, it barely escaped a closing below 50d EMA on the weekly chart, but the momentum of the Nifty 50 is very weak, so breaking below this important level is a high possibility (as it is on the weekly chart, so only a weekly close below 50d EMA level will matter).
Nifty today & tomorrow: What is driving it
Primary factors driving Nifty
To get the full picture, we need to understand what is driving the momentum in Nifty. Primarily, they are-
- Economic growth slowdown
- Earning’s slowdown
- Valuations and FII selling
- Other macro factors
- India’s GDP growth in the second quarter (July-September) was the slowest in the last 7 quarters at 5.4%, down from 6.7% in the previous quarter. The deceleration in growth momentum was driven by an industrial slowdown and a moderation in investment demand. After that, many analysts slashed their forecast for India’s GDP growth in the current FY, e.g., the first advance estimate suggests a real GDP growth rate of 6.4%, down from 8.2% in FY24.
- This slowdown in GDP growth was a primary reason for dimming sentiment in markets, followed by earnings slowdown and heightened valuations. India Inc.’s Q2 earnings were a disappointment, and Nifty 50 EPS growth was at its slowest pace in the last many quarters.
- The consensus earnings per share (EPS) growth forecast for the Nifty 50 has been slashed from 10% to a modest 2.5%, with analysts now predicting that index firms will close FY25 with an EPS of Rs 1,000, marginally up from FY24’s Rs 977. Before Q2 numbers were released, the consensus FY25 EPS estimate was near Rs 1,100.
- A slowdown in GDP, falling earnings growth, and the Indian market being at a premium compared to other emerging markets were the reasons foreign investors started selling Indian equities. The Indian bull market rewarded investors well in the last few years, so when earnings started slowing down, booking profit made sense. A selloff that started as profit booking due to valuation discomfort intensified once the US election results came out.
- With Donald Trump’s victory in the US elections, investors started positioning themselves accordingly. Trump’s expected America First policy gave a boost to the USD index, and other currencies, especially EM, fell against it.
- The rupee fell to an all-time low, making Indian equities less attractive to FIIs, so selling intensified. FIIs have sold more than 2lac crore (more than $26 bn) worth of Indian equities since 27 Sep, 2024.
What’s next?

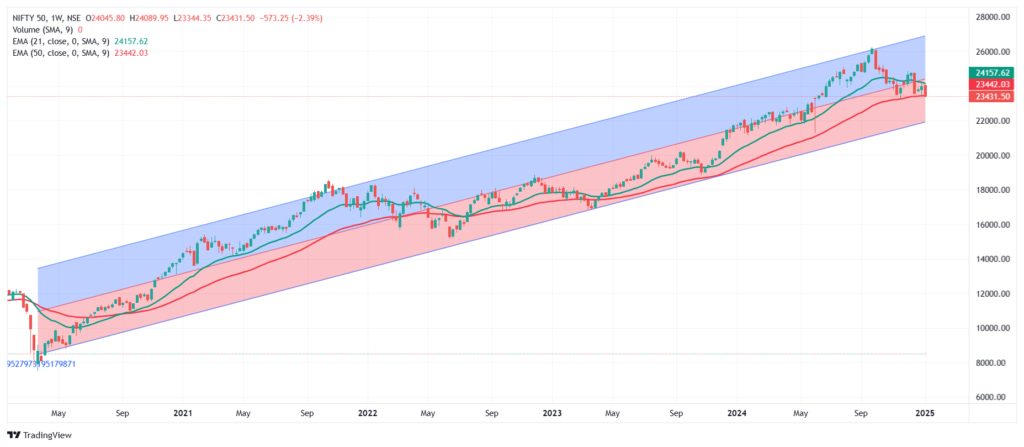
Above is a weekly chart of Nifty, if 24,400 (50d EMA of Nifty 50 on W chart) is broken on a weekly closing basis then it will open the door for Nifty to touch the lower point of the regression trend’s bottom at 21,900-22,100 range (I will keep watching the movement of Nifty 50 in next week to take cues about it).

To strengthen this view with another indicator, Nifty’s current leg started from Jun 4 lows, and the current level (23,350 – 23,400) happens to be the 61.8% retracement level in the Fibo retracement channel, also considered as the strongest support in this series. If it breaks, then the fall can extend to 22,500 – 22,600 (78.6% retracement). If Nifty defends its current zone and reverses, it will face resistance at 23,800 and 24,100 (suggests option data and moving averages).
Conclusion
As Q3 numbers are starting to come out, though the expectations are muted from Q3, investors will watch the numbers and management comments of sectors like FMCG, Consumption, IT, and Banks to forecast future earnings. Estimates suggest that H2 will be better than H1 in terms of GDP growth, powered by agriculture sector growth and government capex.
Green shoots are already visible as India’s industrial output, as measured by the Index of Industrial Production (IIP), grew by 5.2% in November 2024, reaching a six-month high, up from 3.5% in October. Manufacturing output rose by 5.8%, while mining production increased by 1.9%, and power output grew by 4.4%. For the April-November period, industrial output increased by 4.1%, compared to 6.5% in the same period last year.
Investors will also keenly watch the upcoming budget (scheduled to be released on Feb 1) and the upcoming RBI monetary policy meeting (FEB) for major macro indications.
Note- The Above post is data-backed research and not a piece of investment advice; consult your investment advisor for any buy-sell decision.
