The BSE Midcap index is down more than 20% from the recent highs of 49,700. The index made a low of 38,950 last week, reversed, and it is currently trading at 40,100. With the divergence in place, the question of, whether the correction done in the Midcap Index is making rounds.
In the last few days, the broader market ( mid and small-cap index) is outperforming key indexes like Nifty50, and Sensex so let’s analyze with data, how much more fall is there, and if the correction is over then what’s next?
BSE Midcap Index is a significantly broader market index, and its movement is a key to judging the overall market breadth. The BSE Midcap is designed to represent 15% of the total market cap of the BSE Allcap after the large-cap index. The index represents the mid-cap segment of India’s stock market, and it was launched on 11 April 2005. The current number of constituents in this index is 132.
BSE Midcap Index Today: How is the chart placed
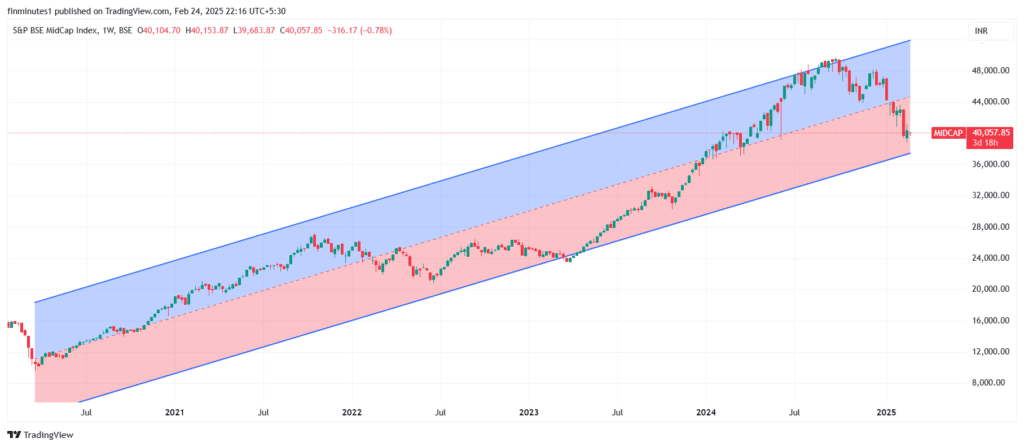
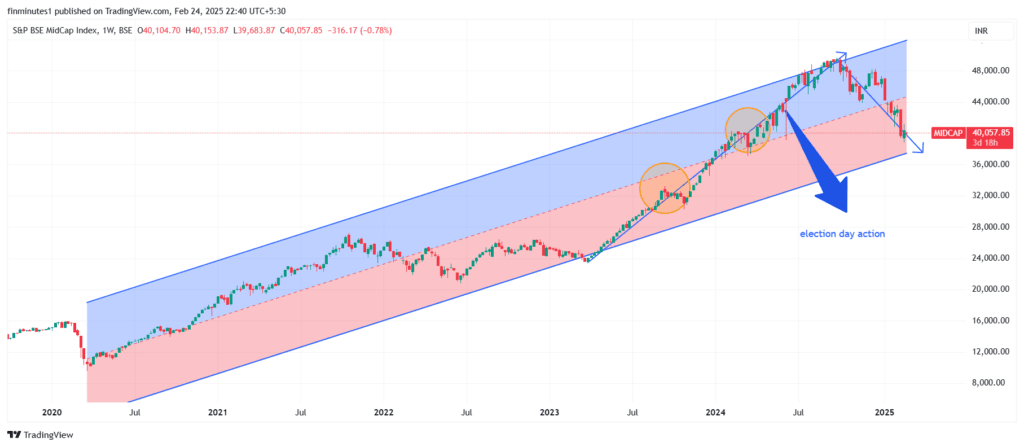
Midcaps were on a one-way rally from April 2023, with a swift correction in between. BSE Midcap Index doubled in less than 2 years ( from 23,200 in April 2023 to almost 50,000 in Sept 2024). The current market capitalization of the BSE Midcap Index is 6,042,846.23 cr, and it is trading at a P/E (price/earnings) of 31.76. The current P/B (price to book) of the index is 4.09x.
- While at its peak in Sept 2024, P/E of the BSE Midcap index’s P/E was 43.4x.
- At its peak, the index was trading at a price to book of 5.1 times.
- Median P/E of the BSE Midcap index is at 33.1x, while the median price to book is at 4.3 times.
- Both valuation metrics suggest that after a significant correction, BSE Midcap is trading at a discount to its historical valuation.
Guessing the index moment going ahead
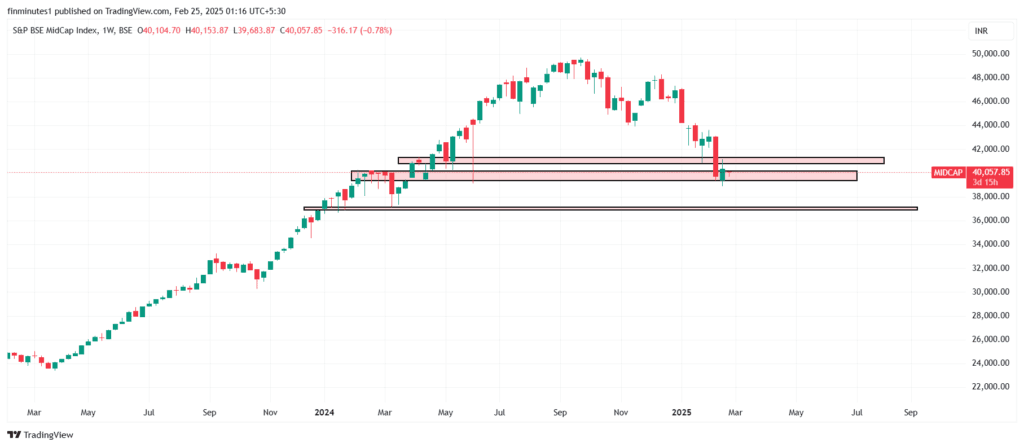
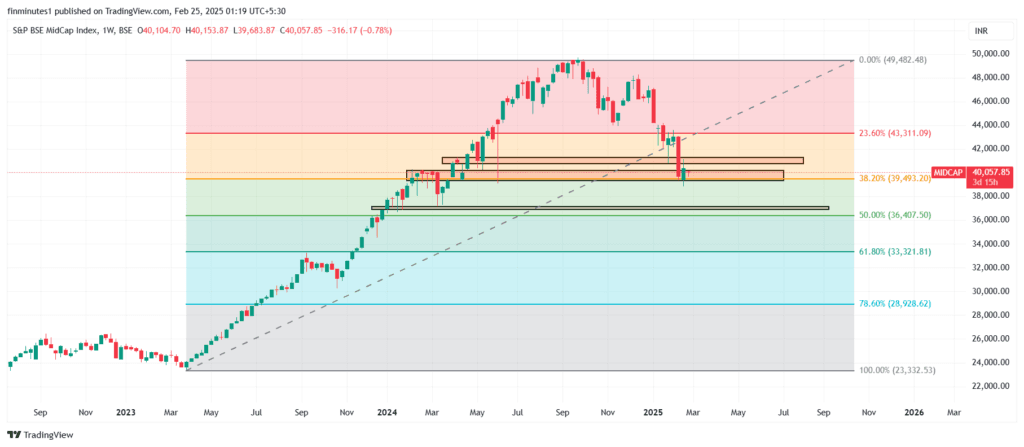
Most of the technical indicators are suggesting that the fall is about to end in the Midcap index; there is divergence in price, and it took support at a very crucial level. As visible in the above charts, the index recently took support in the 38,900 and 39,200 range (S1), also the 38.20% retracement in the Fib retracement series ( a descent support) lies in the above range. As long as the index is above 38,900, our view will remain constructive on the index.
If the above support is broken, the index could fall in the 38,100-38,150 range (S2). One large support for the index is the 36,950 and 37,100 range (S3), which also coincides with a 50.00% retracement in the Fib series. The immediate hurdle on the upside will be in the 41,200- 41,400 range (R1), followed by 43,000-43,200 (R2).
In terms of constituents, the top 10 stocks have more than 20% weightage. In them, Max Healthcare, Indian Hotels, Persistent Systems, Suzlon Energy, Coforge Ltd, PB Fintech, Dixon Tech, Lupin, Federal Bank, IDFC Bank are top index constituents with a combined weightage of close to 20%.
For more cues, digging deep into the charts of these top constituents is a good idea as they dominate the BSE Midcap Index and their price movement decides the index’s movement.
- Max Healthcare’s chart is weak with immediate support at 950 and resistance at 1090.
- Indian Hotel’s chart is relatively strong and trading near a strong support.
- The persistent system’s chart is also on strong footing with limited downside (the risk of a US slowdown impacting Indian IT stocks is there).
- The chart of Suzlon Energy suggests that the stock is already done correcting and the breakout will be confirmed once it is above 59-60 range.
- Coforge has seen a sharp correction of 25% in just a few weeks and if it falls below 7,200 the fall can extend to 6,650- 6,700. The immediate hurdle will be in the 7,900-8,000 zone.
- PB Fintech is taking support in the 1450-1550 range, and the immediate hurdle on the upside will be at the 1690-1750 zone.
- Dixon Tech is also making a base and immediate support will be at the 13,100-13,300 range and resistance at 15,300-15,500 range, big upside can follow once these levels are taken out.
- Lupin is among the least corrected stocks in the BSE Midcap Index, base formation is in process and confirmation will happen once it takes out the 2,000 zone. On the downside, 1780-1800 is a strong support.
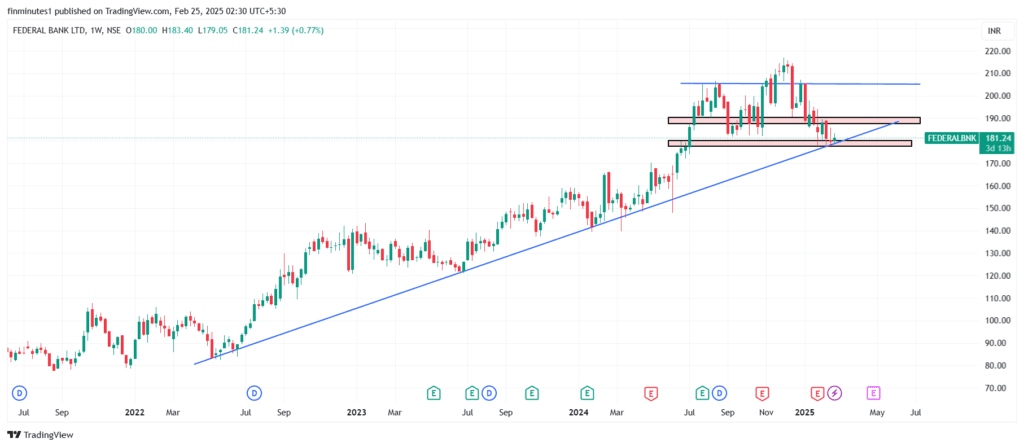
- Federal Bank chart looks good; if the weekly close is above 190, the stock will be ready to take out previous highs.
- IDFC First Bank has strong support in the 52-53 range, and currently, the chart lacks strength.
Conclusion
The BSE Midcap Index has compounded at a CAGR of 14.2% in the last 10 years, starting at a base value of 3,122 in April 2005. It reached a high of 50,000 and is currently trading at 40,100. The index will keep performing well in the long run, and after a decent correction.
It is trading at a reasonable valuation. Investors should add good stocks with decent growth and reasonable valuation, with the advice of a registered investment advisor, to benefit from this correction. Click here to keep track of more research from us.
